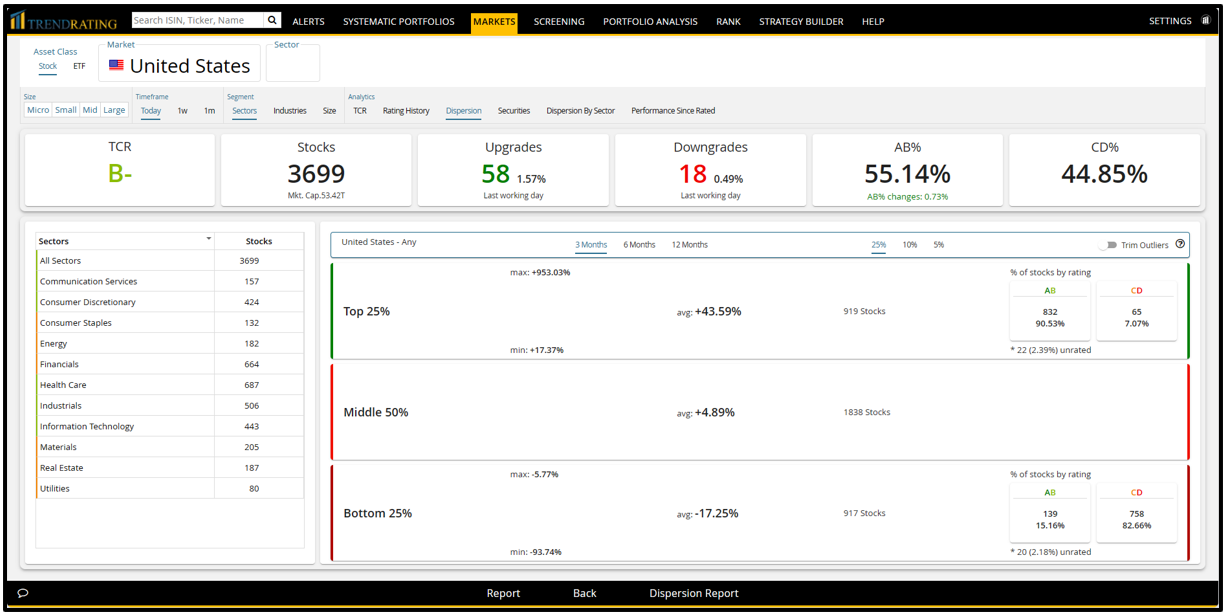
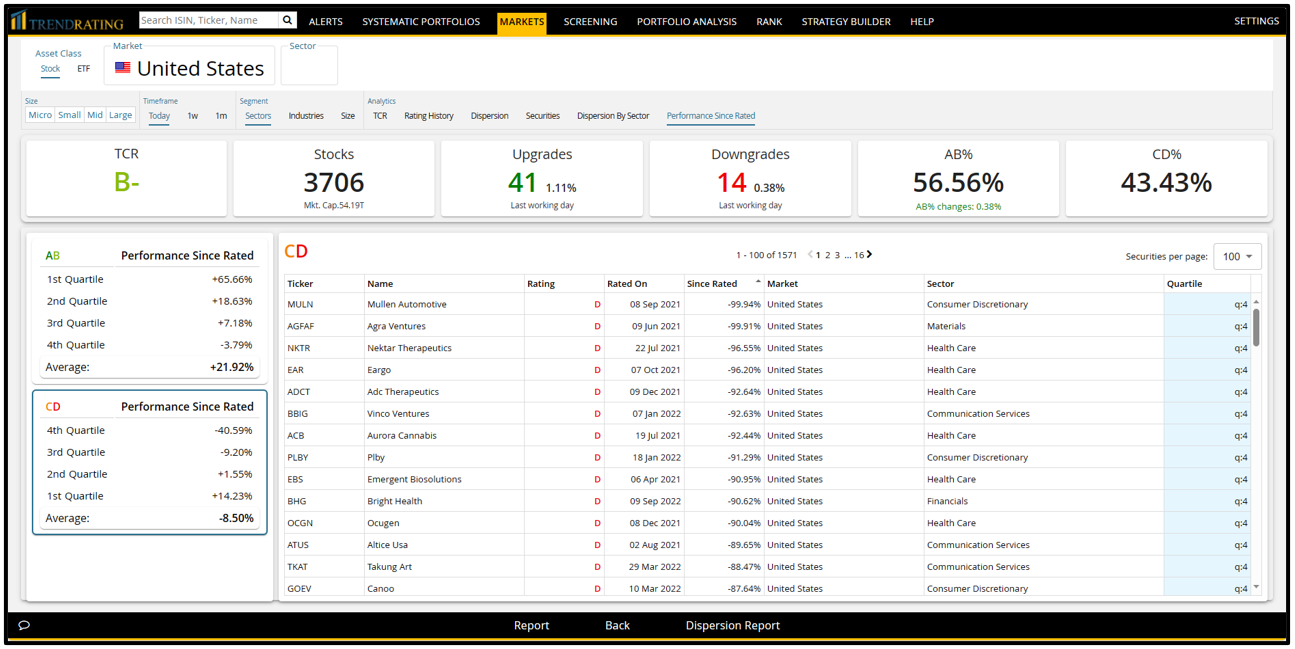
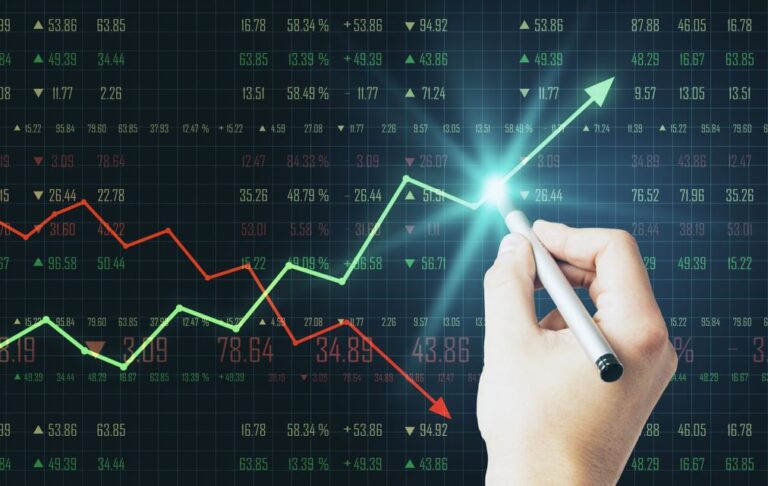
Superior investment performance requires pragmatic fact-finding. The opportunity to maximize returns comes from the performance dispersion across stocks, a phenomenon often overlooked and unexploited. For example, in Q1 2024, the S&P 500 index recorded a gain of 10%. However, the top 25% performers within the index, (125 securities), recorded an average gain of 24%.
Capturing such opportunities is difficult without access to more intelligent information. This is why many active portfolio managers tend to underperform the benchmark. The solution is getting the answers to some key questions:
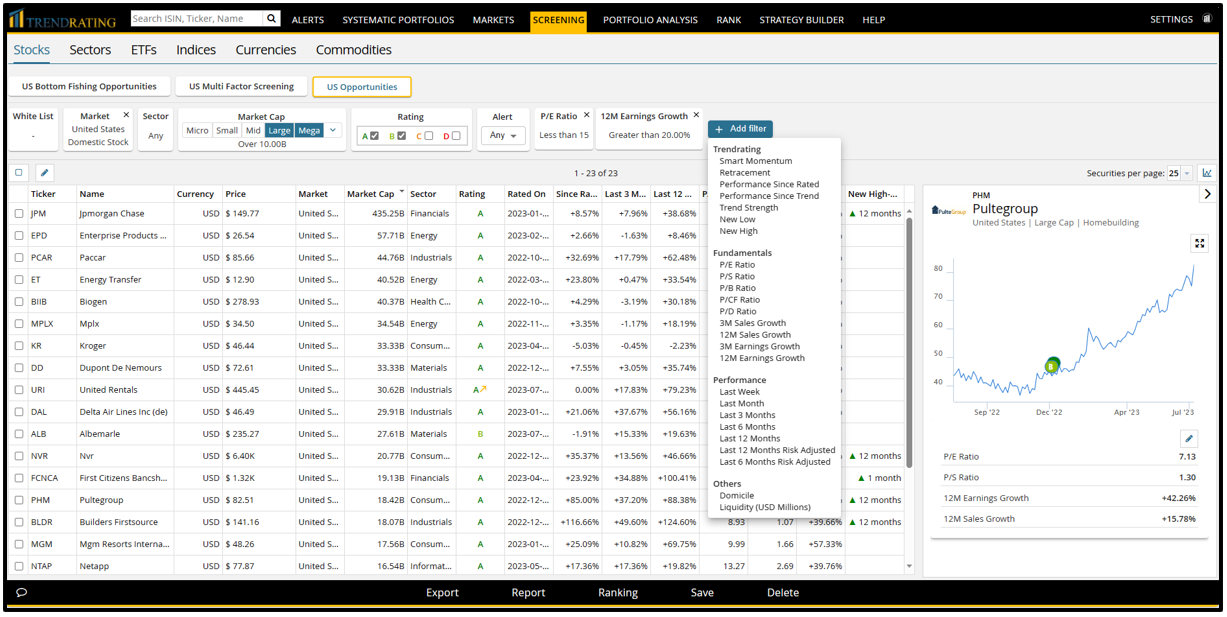
What are the fundamental parameters that best profit from the performance dispersion by capturing the outperforming stocks?
What are the selection rules that provide a sound investment decision framework to maximize performance?
Trendrating mission is to provide the answers that can make a difference.
Our leading-edge platform enables a more effective performance management of equity portfolios.
With Trendrating technology our customers can:
The measurable impact on performance is obvious and fully measurable.
Better information, better decisions, better returns.
The new market cycle is exposing the limits of conventional data and tools. negative trends are more frequent and extreme. Effective risk control requires smarter analytics and technology supporting a fast reaction to events.
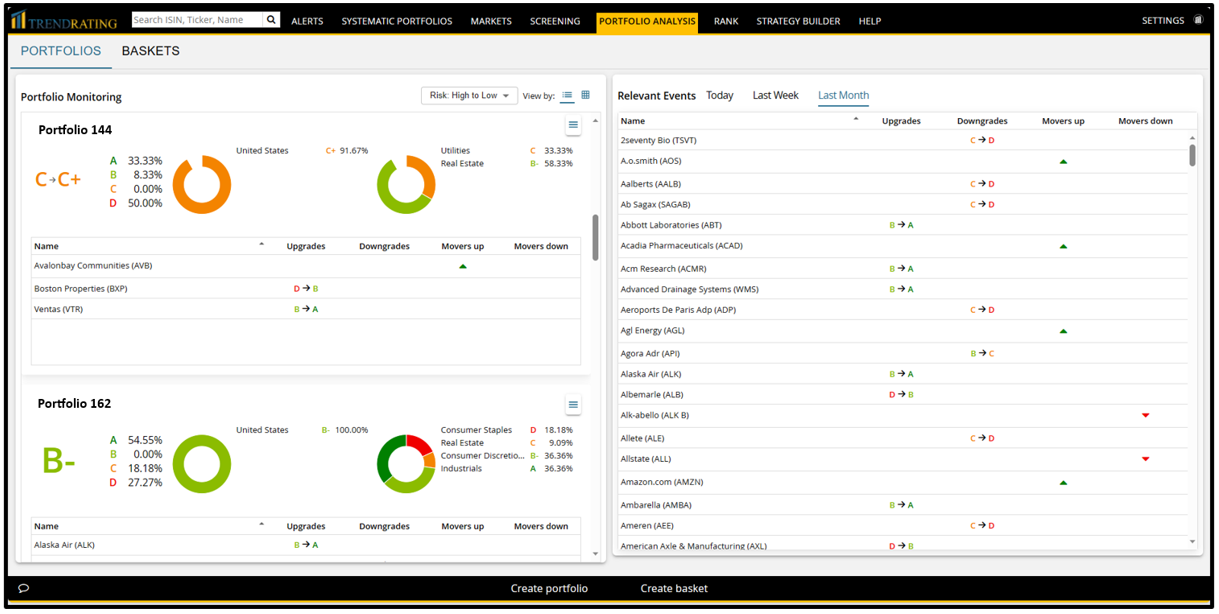
We introduced a new paradigm for portfolio risk control. We add an element of trend risk control. Our solution enables the analysis of the trends allocation risk for portfolios. The larger is the portfolio exposure to falling stocks the bigger is the risk of losses. A pragmatic, factual and logical methodology to see the risks from another perspective, as the performance of a strategy is directly linked to the trends of the holdings.
Our clients can easily calculate the combined trend risk across all the managed portfolios and promptly identify those that incorporate excessive risks, due to an overweight on securities in a bear trend. Adjust and optimize the holdings to get a safer exposure.
The challenge. Selecting and validating what stocks to buy or hold should take into consideration several factors. A key factor if the actual price trend. Neglecting a sound assessment and respect of the current trend direction is the primary cause of underperformance. Omitting a pragmatic sanity check of the evident price evolution is a high-risk choice. A systematic, objective, well tested methodology can fill this intelligence gap.
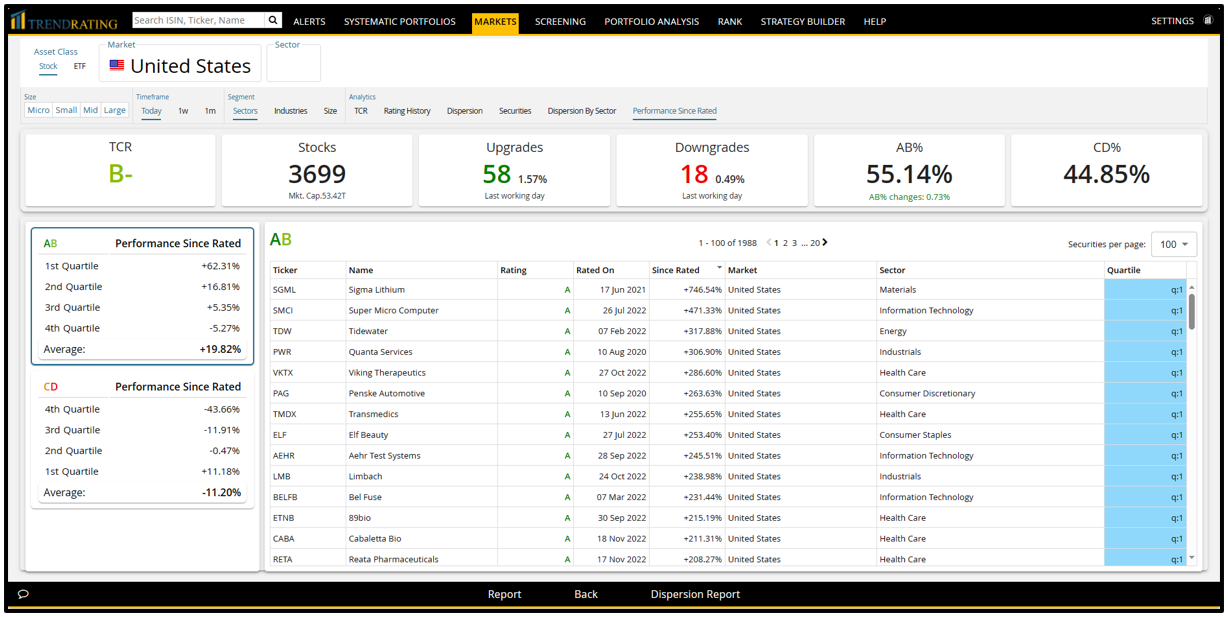
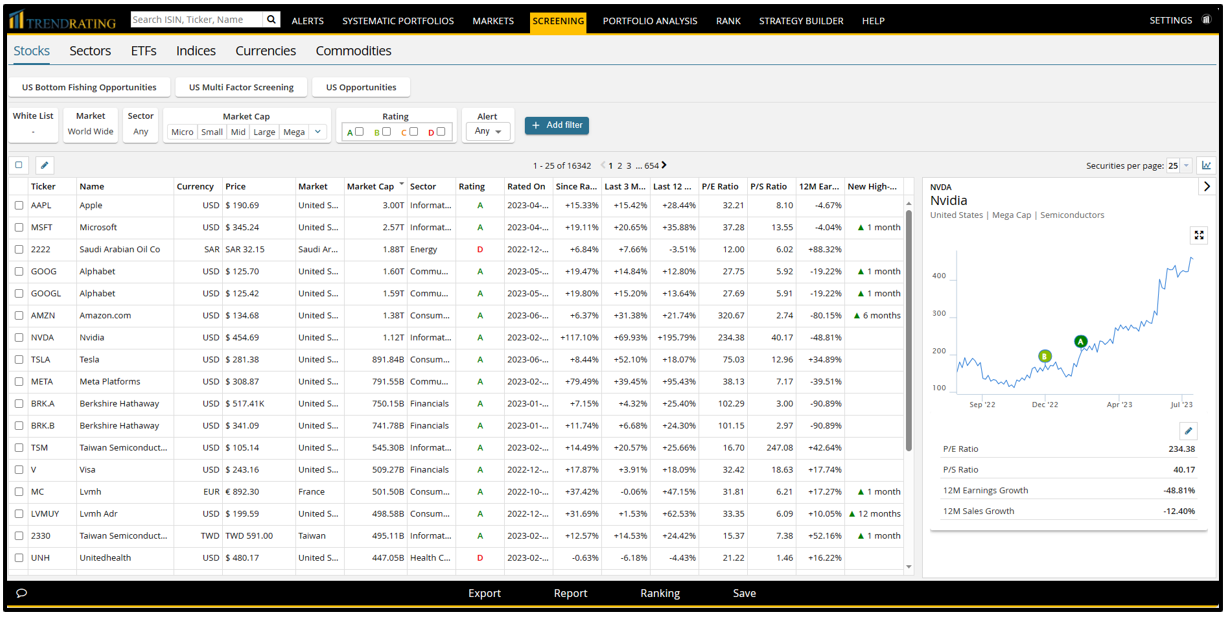
The solution. Use Trendrating to validate investment ideas, as the confirmation of a positive trend in motion adds strength to the decision and reduces the risks. When considering a list of stocks to buy, Trendrating can add an extra layer of trend quality ranking to select the best opportunities.
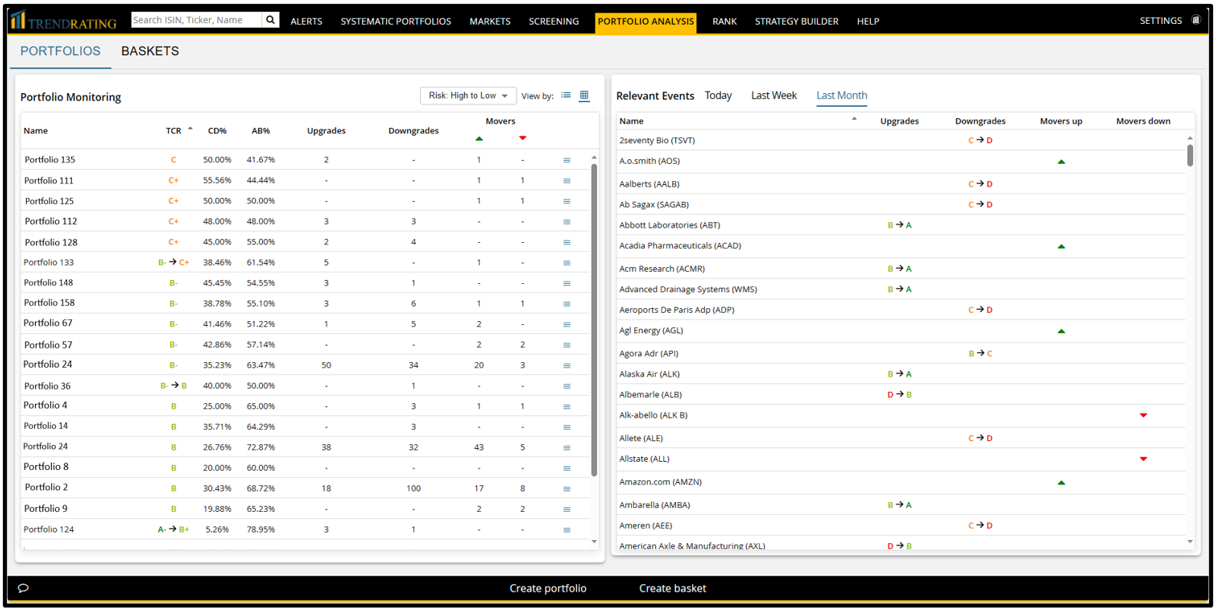
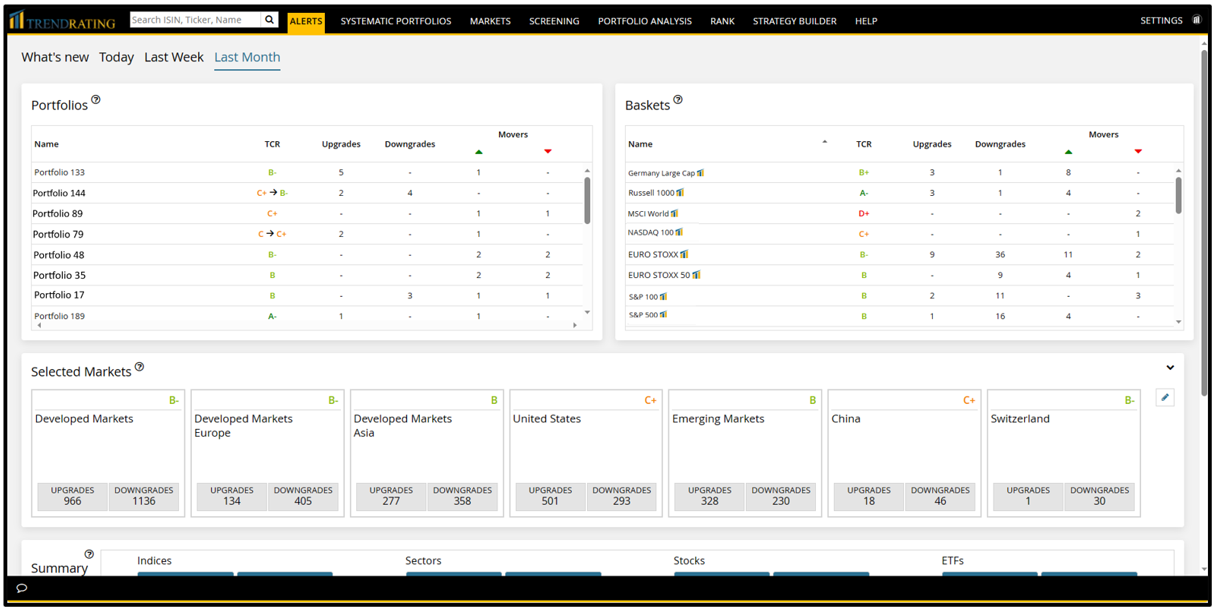
The challenge. There is an element of risk that some investors ignore – the trend risk. It is the risk of holding a stock that starts turning down, proving that the selling pressure outweighs the buying interest, and may well experience a bear trend, whose extent is uncertain. Managing multiple portfolios makes it difficult to oversee all the holdings and spot in time negative trend reversals that generate new risks.
The solution. Use Trendrating to efficiently monitor the equity exposures, via prompt alerts in case of emerging trend risks in any security. A downgrade points to a high probability of more damage to follow.
The challenge. Monitoring an investment universe is time consuming. New investment ideas are often generated a bit late, after an obvious positive trend started. The outcome is missing profitable opportunities or being late for lack of timely information.
The solution. Use Trendrating to quickly spot the start of a bull trend in any stock within the investment universe of your interest. You are then alerted in time to profit from the potential rise, and decide if the opportunity fits your investment rules.
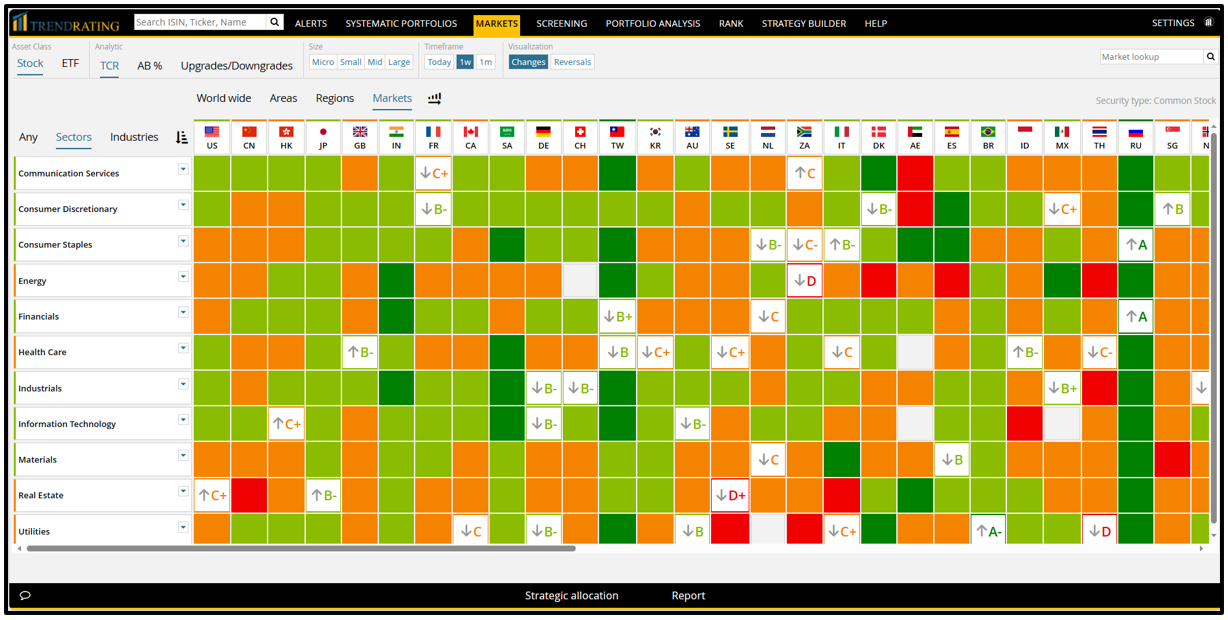
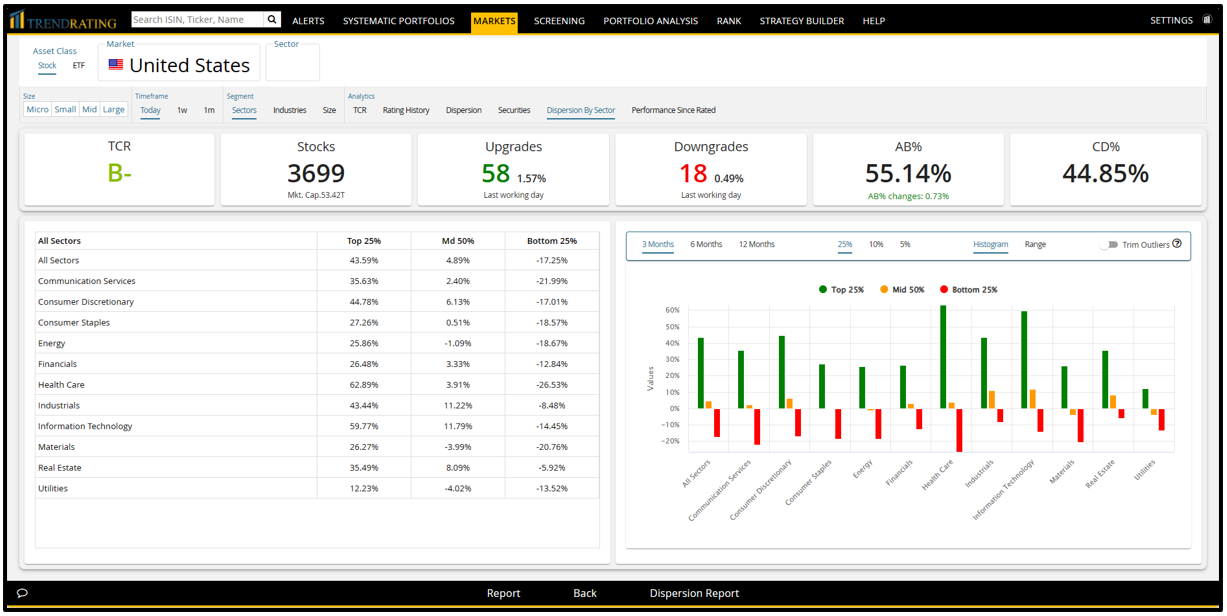
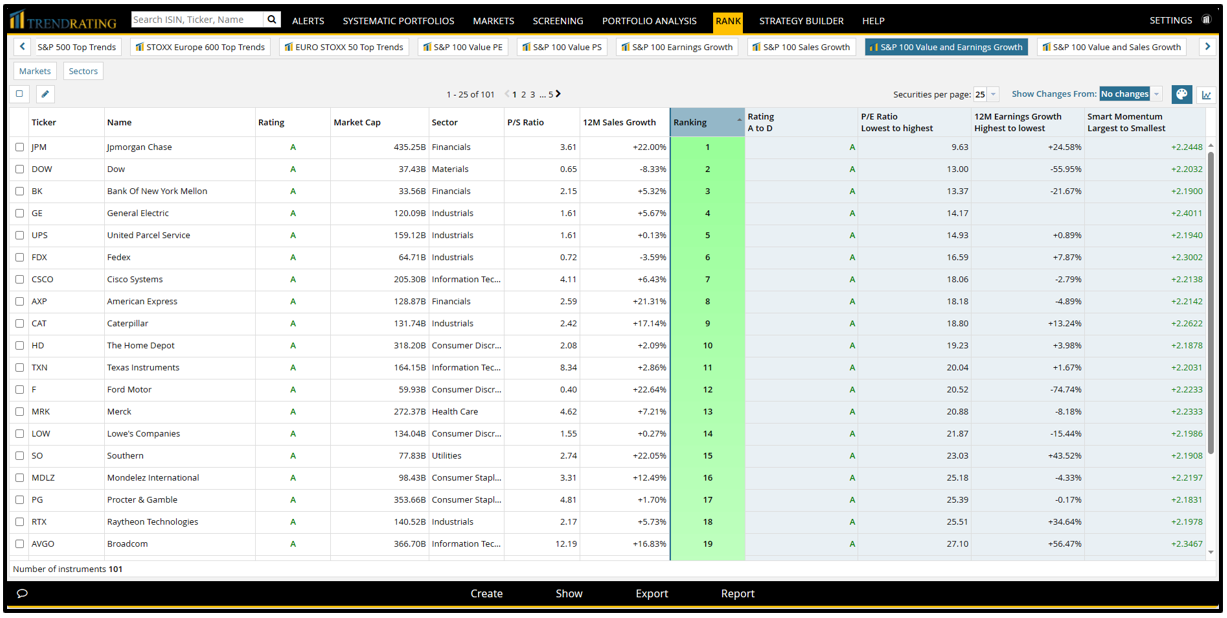
The challenge. The allocation framework can generate higher returns if also optimized on the specific strength across markets and sectors. A sector where a large part of the stocks are in a bull trend, is more appealing than a sector with only a few stocks rising. However, how can one measure and compare the aggregated strength of any sector to maximize the upside potential and reduce risks?
The solution. Use Trendrating to calculates the aggregated rating for any list of stocks. It provides consistent, objective metrics to enhance the allocation with a layer of trend validation.
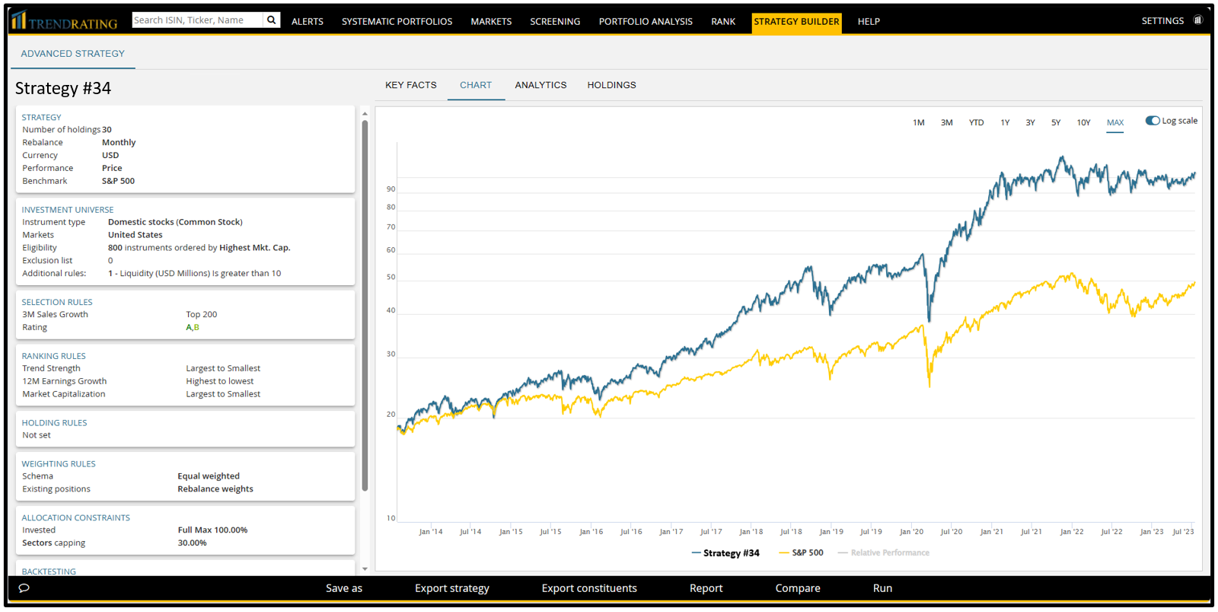
The challenge. Any investment strategy can unquestionably be improved at any time. However, designing, testing, optimizing and validating an active strategy requires a rich data set and state-of-art technology.
The solution. Trendrating developed a solution that makes this critical and complex task easy and fast. Use Trendrating to construct investment strategies, combing rock-solid fundamentals and the company proprietary trend discovery analytics, to obtain a solid blend of quality and pragmatism. The user can design his/her own strategy, defining the rules and the parameters from an extensive library of data and indicators. It is then easy to run a test for up to 15 years of history, optimize the parameters to maximize the performance, document the results, and finally execute.
The challenge. The new market cycle is changing the game for product issuers. The end of the 12 years bull market will expose the inadequacy of many investable products that prospered in the good days. As investors realize that a passive product can be a source of repetitive losses, they will shift assets elsewhere. Therefore, the opportunity is filling the inevitable future demand of intelligent products, that can deliver alpha also in a low to negative returns cycle that can last years.
The solution. The way forward is advanced active management, profiting from the recurrent performance dispersion inherent in any investment universe, across different market cycles. Farsighted operators launching innovative products, will capture a significant share of the assets reallocation at the expense of those that will persist with a conventional offer range, detached from the new course. Use Trendrating to design products combining the best of fundamental analysis, and a safe proprietary trend validation filter, enabling a more robust investment story.