2015 was an interesting year for stock investing. We started the year on an optimistic note with many markets boasting double-digit returns at the end of the first quarter. However, as year-end approached, the boom fizzled out and most markets ended the year flat to down.
In this article by Matt Egan published in CNN Money, we see some of the worst performing stocks, in the S&P 500, for 2015.
Below we will show how Trendrating’s proprietary Momentum Analytics platform was able to spot the down trends in these stocks early, significantly reducing (and in some cases completely eliminating) downside capture.
The Table below summarizes the performance, in 2015, of the Worst performers in the S&P 500 Index.
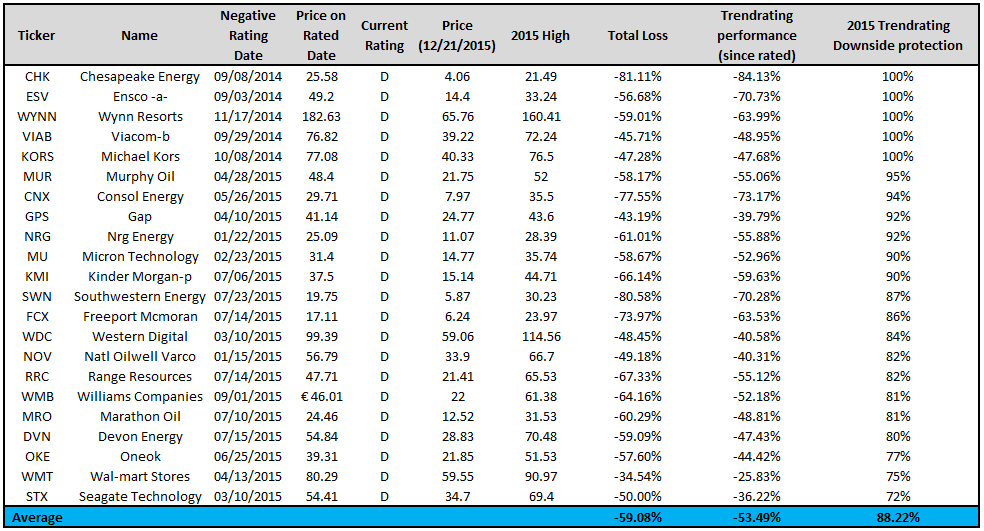
The Total loss column measures the total loss in each stock from its 2015 high to its close price on December 21, 2015. As you can see, despite the S&P 500 ending the year pretty flat, the average stock on this list has lost almost 60% this year.
Trendrating performance (since rated) captures the return from the time the negative rating came on until December 21, 2015.
2015 Trendrating Downside protection is the proportion of the Total loss that would have been avoided by following Trendrating’s timely negative rating call. Note that the negative rating was issued in 2014 for 23% of these stocks. For these stocks we capped the 2015 Trendrating downside protection at 100%.
As you can see, on average Trendrating was able to capture almost 90% of the downward move, warning investors early enough to protect the vast majority of their profits.
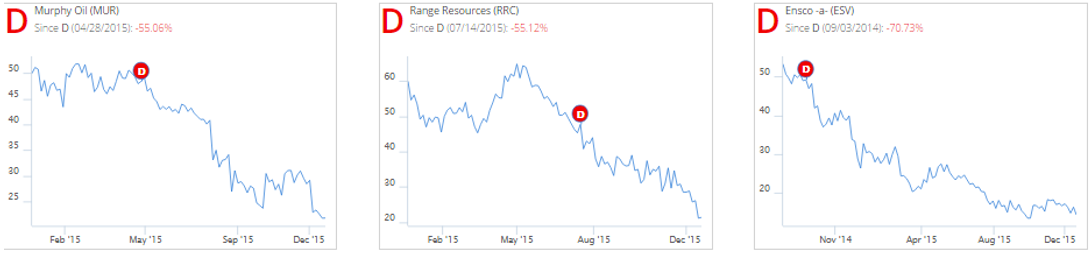
Below are some example charts showing the timing of some of these ratings.