This report will analyse the universe of indices covered by Trendrating. It will assess the distribution of momentum ratings, summarize rating changes observed over the last month, validate the performance of issued ratings over various time periods and finally, will graphically show the timing of some issued positive and negative ratings.
Indices: Momentum Rating Distribution
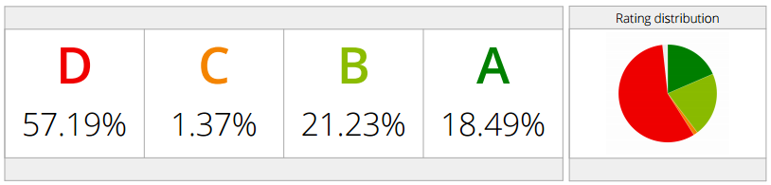
Currently about 40% of indices, covered by Trendrating, have a positive momentum rating. Below, we will compare the performance of these positively rated indices to their negatively rated counterparts.
Rating Changes over the last month
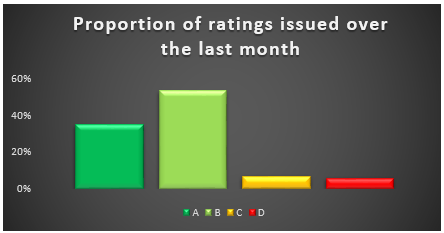
The chart above displays the proportion of ratings issued for indices over the last month. We see that about 88% of ratings were for indices moving into positive momentum. As markets started their recovery in late February, the Trendrating momentum model started issuing proportionally more upgrades than downgrades. This ability to quickly spot momentum changes is a key advantage of Trendrating over legacy momentum models.
Indices: Momentum Rating Performance
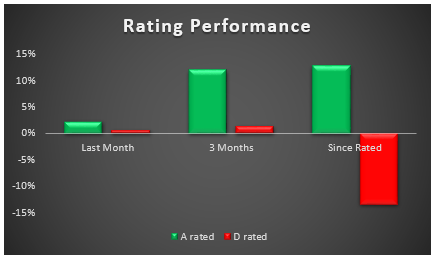
The chart above compares the average performance of A rated indices to those of D rated indices over one month, one quarter and on a “Since Rated” basis (performance since the most recent rating). We find that A rated Indices have outperformed their D rated counterparts over all time periods with particularly significant outperformance observed on a Since Rated basis. This is again good evidence of a model that quickly and accurately captures changes in momentum
Best Performing Indices over the last three months
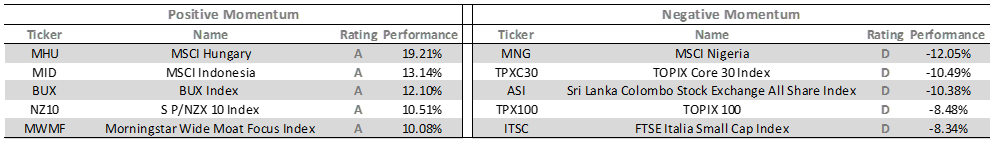
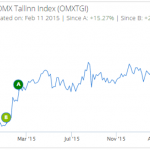
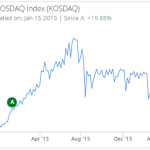
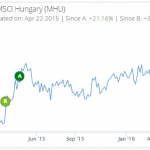
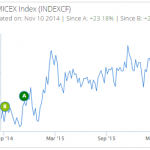
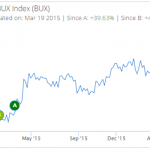
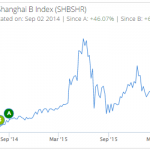
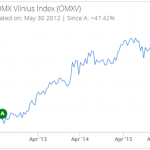
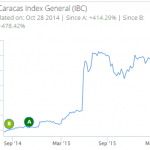
Charts: Positive Momentum
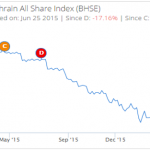
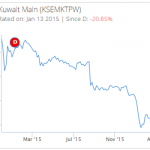
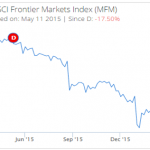
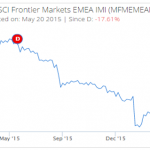
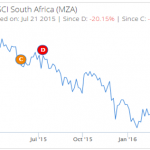
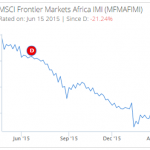
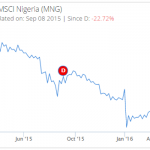
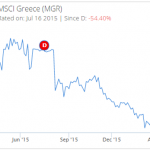
Charts: Negative Momentum