

Too often investors base their investment decisions on assumptions that the parameters and rules they use to select stocks are effective to deliver alpha. They make sense, but do they really make money?
Did they have the opportunity to test them across a meaningful historical window and validate the hypothesis with robust evidence? Without hard evidence confirming the historical value of their presumptions, any investment strategy risks being fragile.
A rigorous, objective test of the actual alpha generated across market cycles, say 10 to 15 years of history, can be enlightening as it provides hard facts vs. expectations of something that are taken for granted. A sanity check of the drivers of an investment strategy can deliver valuable insights to discover the true value of the chosen selection rules. This exercise is particularly relevant if the actual portfolio performance results are below expectations on a recurring basis.
The good news is that advanced technology makes possible the ability to:
- Test any fundamental, quantitative, technical parameter.
- Compare the alpha contribution.
- Explore combinations of parameters that checks more boxes and delivers better returns.
- Discover the most effective mix of rules to outperform on a consistent basis.
- Validate and document the results of the exercise.
The formula is simple – better information means better decisions and better returns. Innovative analytical systems enable investors to find the stock selection rules that best profit from the recurring performance dispersion across stocks.
This table captures the differential of returns between the top and the bottom 25% performers in the U.S. large cap stocks investment universe over the last 3 months, as of February 29, 2024.
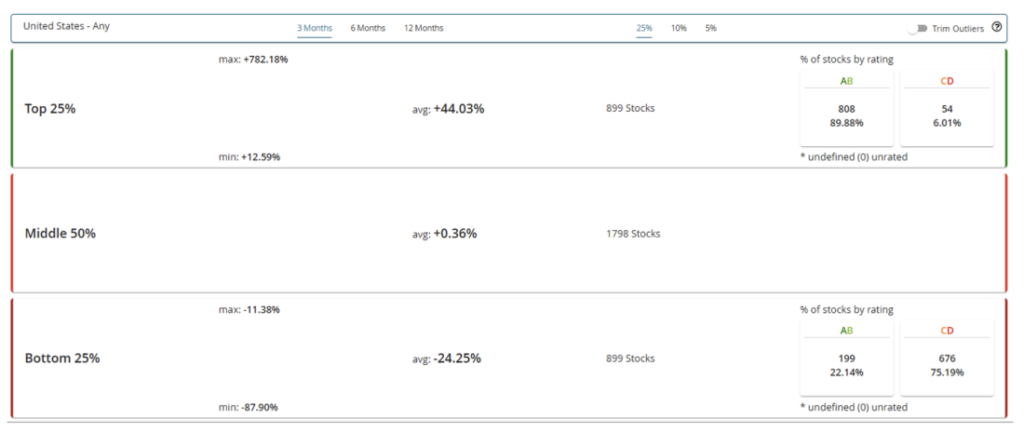
Differential of returns top, middle and bottom US Large Cap performers, past 3 months as of February 29, 2024. Source: Trendrating
Superior performance can only be obtained if one can build a large portfolio exposure to the top performers while avoiding most of the losers and promptly adjusting to trend dispersion evolutions. But what are the fundamental metrics that best contribute to capturing the best stocks?
This chart below is a factual comparative analysis of the performance of some of the most popular fundamental metrics for value and growth investment approaches. The statistics show the average annual return of each metric, testing every parameter across the last 10 years with the investment universe being US large cap stocks. We analyzed strategies selecting the best 100 stocks for any specific metric and a monthly rebalancing when required.
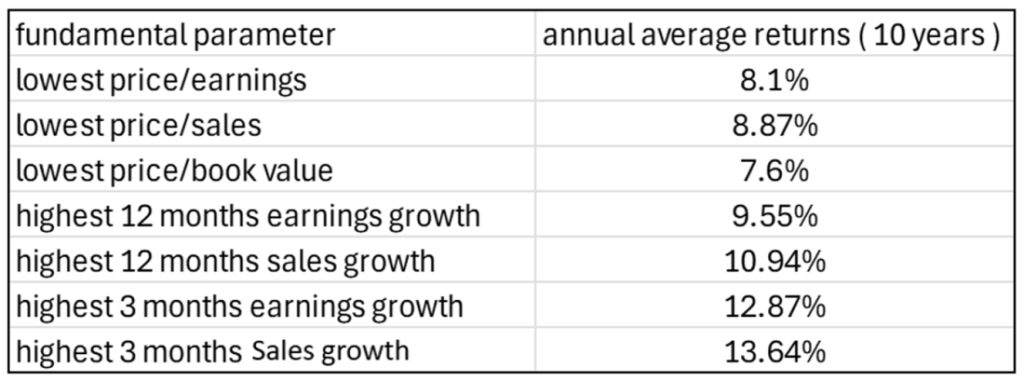
Fundamental metrics over past 10 years as of February 29, 2024. Source: Trendrating
Exploiting dispersion in different markets and sectors may require a different mix of rules. This chart is just an example of the insights that can be extracted via a pragmatic, rigorous test across a reasonable time window.
After objectively assessing the true alpha contribution of single selection rules, the next step is a smart exploration of alternative combinations of two or more parameters. The ability to investigate multiple combinations can lead to valuable discoveries. By checking more boxes, the stock selection process can gain extra quality and produce better returns.
Refining a value strategy, a growth strategy, and even merging value with growth can also lead to discovering a better investment workflow. The benefits of a factual, pragmatic test for any investment universe and set of metrics, across a reliable time window covering a few market cycles, can be a game changer.
Advanced technology that can enable this mission-critical discovery process is today available to anyone. Consider profiting from these available leading-edge systems that, by delivering better information, can unlock better decisions and produce better performance as facts win over assumptions.
The views and opinions expressed herein are the views and opinions of the author and do not necessarily reflect those of Nasdaq, Inc.
Source: Nasdaq Inc.