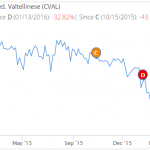
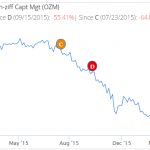
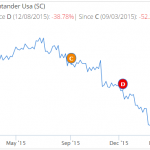
January was a terrible month for global equity. The pain in January continued into February. Since mid-February however, equity markets, driven by select sectors, have experienced a modest recovery.
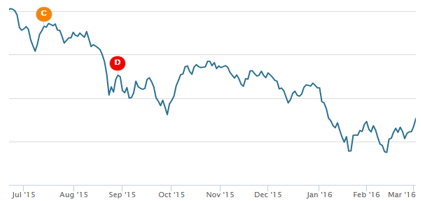
The chart above displays the most recent momentum ratings issued by Trendrating to the FTSE All-Word ex US Index and is representative of what happened in global markets.
Smart Momentum analytics, as supplied by Trendrating, detects changes in momentum quickly and reliably, helping investors limit downside capture and protect profits in down markets while presenting positive momentum opportunities not to be missed by the discerning investor.
This report will analyse the changes in momentum ratings (Alerts) issued by Trendrating in the month of February. It will use this information to identify the three sub-sectors with the strongest move into positive momentum as well as the three sectors heading deeper into negative momentum territory. Ultimately we aim to figure out if smart momentum analytics adds value in both up and down markets.
Analysis of Alerts issued in February
Mining, Electricity and Fixed Line Telecom had the highest amount of issued positive momentum rating. While Financial Services, Pharma & Biotech and Banks had the highest proportion of issued negative ratings.
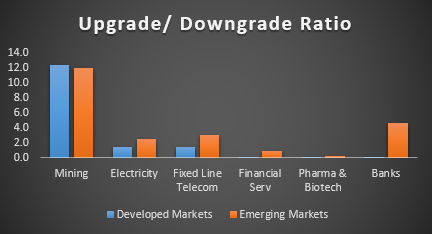
The chart above explores the ratio of Upgrades to Downgrades in the sectors with the most alerts. It analyses rating changes in Emerging Markets (EM) separately from Developed Markets (DM). We see that Mining, the best performing sub-sector so far on a YTD basis, had the highest Ratio. The Ratio in the Mining sub-sector was high for both Developed Markets and Emerging Markets. Electricity and Fixed Line Telecom had Ratios greater than 1 (more upgrades than downgrades) but rating performance was driven by upgrades in EM for both these sub-sectors. In DM, Financial Services, Pharma & Biotech and Banks all had Ratios that were significantly less than 1. In EM Banks, we see an interesting development. Banks in Emerging Markets were moving into stronger positive momentum while their counterparts in Developed Markets were heading in the opposite direction.
Rating performance
How are Trendrating’s momentum ratings performing in these universes?
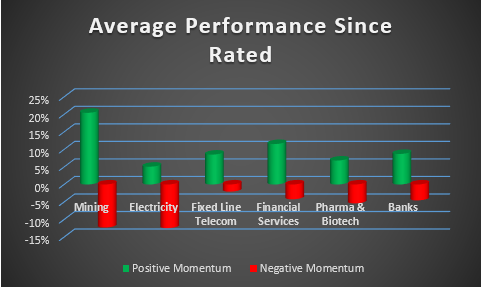
Figure 2 above compares the performance of stocks with positive momentum ratings to stocks with negative momentum ratings. We find that on average, positive rated stocks are outperforming negatively rated stocks by about 17%. This out performance is six percentage points higher for the sectors in positive trends.
In conclusion, after a relatively poor start to 2016, some sectors are beginning to find their mojo. Trendrating’s Smart Momentum Model has been able to identify winning and losing sub sector by delivering accurate, timely momentum ratings to their constituents. Timely ratings also mean that Smart momentum analytics provides value in markets that are trending upwards or downwards. Finally, Emerging market equity appears to be benefiting more from the up-tick in financial markets than Developed Markets.
Charts:
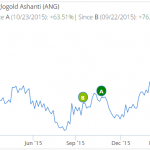
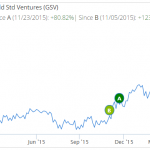
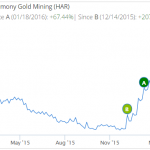
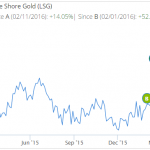
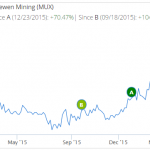
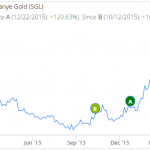
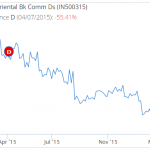
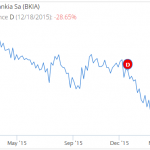
Below are some charts of positively and negatively rated stocks showing the timing of the most recent ratings
Positive Momentum:
Negative Momentum:

