US Technology stocks have continued their relatively poor start to 2016. At the time of writing, the Nasdaq Composite index is down 5.5% while the S&P 500 Index is up about 1.04% on a YTD basis. Exploring S&P 500 Gic Sectors, we find that Technology stocks are out performing only Financials and Health Care….again on a YTD basis.
Smart Momentum A_fnalytics, as supplied by Trendrating, detects changes in momentum quickly and reliably, helping investors limit downside capture and protect profits in down markets while presenting positive momentum opportunities not to be missed by the discerning investor.
This report will utilize innovative momentum analytics to assess the current state of US Technology stocks. We will analyse recent changes in momentum and the performance of Trendrating’s momentum ratings. Finally, we will also look at the current momentum rating for FANG Stocks (Facebook, Amazon, Netflix & Google).
Rating Distribution:
Below is the current distribution of momentum in this sector as well as the average performance of each rating:

As we can see from the diagram, about 55% of US Technology stocks are currently exhibiting positive momentum. We can also see that we have more than twice as many B rated securities as C rated securities. This is indicative of a sector that is moving deeper into positive momentum territory. The chart below will analyse this by reviewing the momentum rating changes issued over the last month.
Recent Rating Changes:
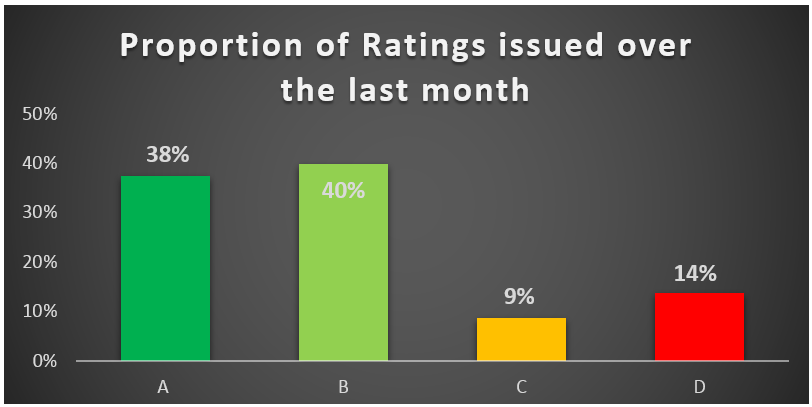
The chart above displays the Momentum Ratings changes issued by Trendrating over the last month for US Technology. We see here that in April 2016, US Technology stocks moved deeper into positive momentum. Only 23% of issued ratings were for securities moving into negative momentum.
Recent Performance:
The Table below, tracks the 3 month price performance of a selection of US Technology stocks in positive and negative momentum for at least three months

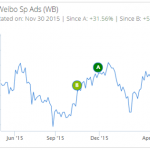
We see here that A rated securities like AMD, Weibo and Ebix, delivered spectacular positive performance over the last three months while negatively rated securities like Sunedison, Internap and Seagate Technologies significantly lagged the broader market.
How are Trendrating’s momentum ratings performing in US Technology sub-sectors?
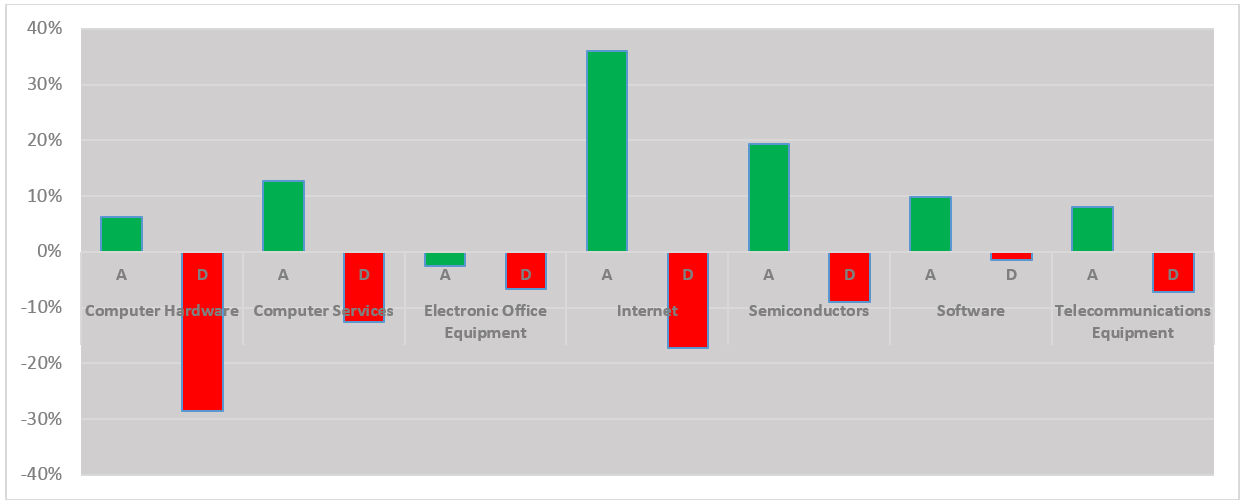
The chart above displays the average performance for A and D rated stocks in each US Technology sub-sector. We see here that A rated stocks are out-performing D rated stocks in every sub-sector. This is more proof that spotting positive momentum stocks quickly and reliably can lead to vastly improved investment performance
FANG Stocks:

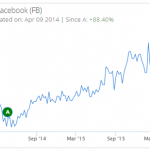
With the exception of Netflix, FANG stocks retain strong positive momentum ratings. Facebook and Amazon have retained their A-ratings since April 2014 and February 2015 respectively and have delivered spectacular market beating performance since these ratings. Alphabet (Google) has been positively rated for less than a year but has returned almost 20% in that time frame, again significantly out performing the broader US market. Negative momentum was spotted in Netflix in February 2016. Since then, the stock is down about 50 basis points, under performing the broader market.
To conclude, while Technology has been an under performing sector (on a YTD basis) in the US market, we have seen some extremely strong performance from A rated stocks and weak performance from their negatively rated counterparts. We see the same picture when we focus our analysis on FANG stocks.
Below are some charts of positively and negatively rated commodities showing the timing of the most recent ratings
Positive Momentum:
Negative Momentum:

