With equity markets entering bear territory this week that witnessed losses of between -27% to -39% for key equity indexes, the rapid stock sell-off offers an interesting comparison to the bear crash of 1987. Back then, the Dow Jones Industrial Average − for example − lost -37% (from 2720 to 1700 on a closing basis), with 90% of the damage produced over a period of two weeks.
The negative phase, dominated by ‘Black Monday’ on 19 October 1987, was short in duration (see Figure 1), and the selling climax marked the end of the negative trend. Following the final acceleration on the downside, markets started to re-establish a base. If this should be the case again, then the good news is we might be close to the bottom.
Figure 1: Dow Jones Industrial Average – The crash of 1987
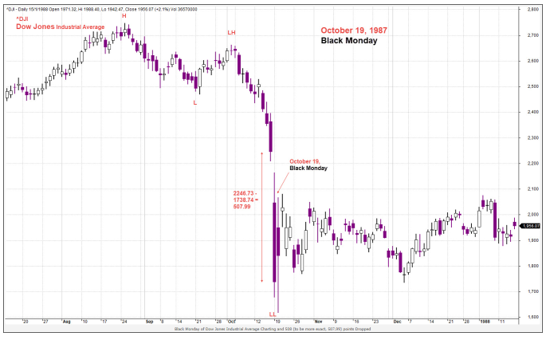
Source: AmiBroker as at 16 April 2018
Among the notable developments during the post-crash period, the performance dispersion among stocks was extremely large. As a number of equities started to show signs of robust uptrends, renewed opportunities to capitalize on the recovery emerged for smart and informed investors during the base-building phase.
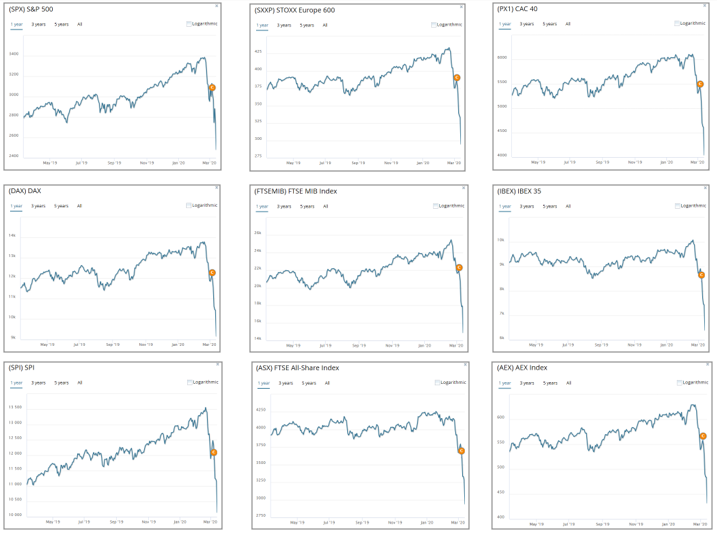
Fast forward to 2020, Figures 2 and 3 illustrate the sharp plunge – recalling memories of October 1987 − recorded by major equity indexes across the US and Europe. Notably, the pan-European Stoxx 600 benchmark plunged 11% on 12 March to record its biggest one-day loss.
Figure 2: Biggest equity market sell-off since 1987 – Performance of US and European stock indexes
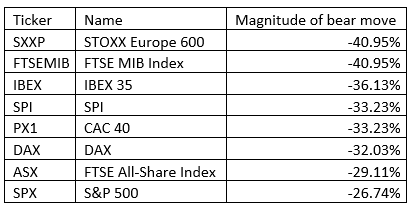
Source: Trendrating, as at 13 March 2020. Performance is calculated from the highs during mid-February 2020 to the close of day as at 3 March 2020
Figure 3: Tracking the bear trend (for more detail, see charts of featured indexes below)
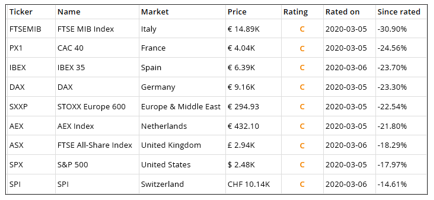
Source: Trendrating, as at 5 March 2020
Yet, amidst the historic sell-off in global equity markets, there are select stocks that have exhibited a strong resilience (akin to 1987), moving against the tide and holding their ground. Given our expectation for a prolonged period of heightened market volatility over the course of 2020 that will likely see indexes moving up and down more frequently, we believe the ability to capture the performance dispersion across stocks, sectors, geographies, ETFs, indexes and portfolio will be key and dictate performance outcomes in 2020.
To maximize such alpha yet also effectively manage risk in this investment landscape, it is crucial for investors to be able to identify those stocks and sectors, which are the most impactful in terms of positive returns, while avoiding a significant portion of those, which prove to be the most damaging to the portfolio. Simply following an index may no longer hold true.
Important Information
The evaluations, rankings and information provided by Trendrating (the “Services”) are provided solely for the use of finance professionals (the “Users”) who have been issued a license to use the Services by Trendrating and who, by nature of their status as investment professions understand, or are expected to understand, the complexity of finance products, the functioning of the markets and the risks inherent in them. The Services are not offered for use by persons not employed or actively working as professionals in the finance and investment industry. The Services are to be used entirely at the risk of the Users. Included in the Services are forward-looking statements that are based on observations, assumptions and calculations that reflect Trendrating’s expectations. Forward-looking statements are subject to numerous risks and uncertainties that could cause actual results to materially differ from those expectations. The Services are not intended to constitute a recommendation of any specific security or financial product and are to be implemented solely in conjunction with or as part of a complete investment evaluation conducted by the Users. Under no circumstances shall Trendrating, its officers, directors, employees or agents be liable for any damages, lost profits or investment losses that result in any way from use of the Services or any interruptions, errors or delays in the Services.