

The performance dispersion across any investment universe is a gold mine for active investors that have the right tools to profit from it.
The ability to “identify and capture” some of the top 25% performers can make a big difference. In 2020, if you examine the S&P 500 constituents, the differential between the top 25% performers and the bottom 25% was massive. The average return of the top 100 stocks was 105% while the bottom 100 was -18%. This is enough to provide an opportunity for prepared, active stock pickers to beat the 16% return of the index.
By incorporating intelligent “trend validation” analytics, active managers will have a high probability to beat the benchmark.
Trendrating tracks and documents performance dispersion across all equities Markets, which can be leveraged using our unique rating methodology.
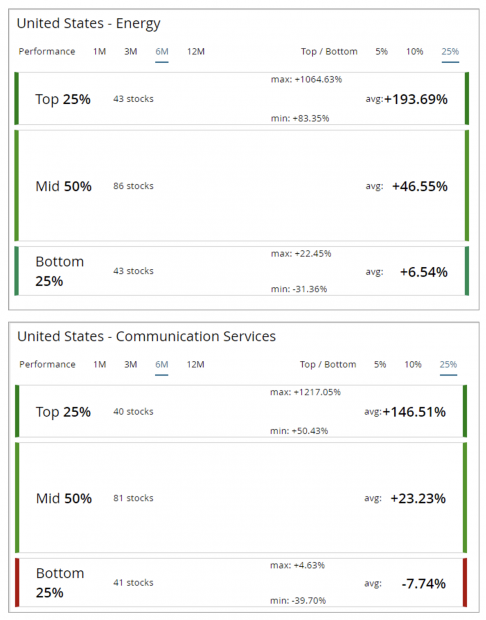
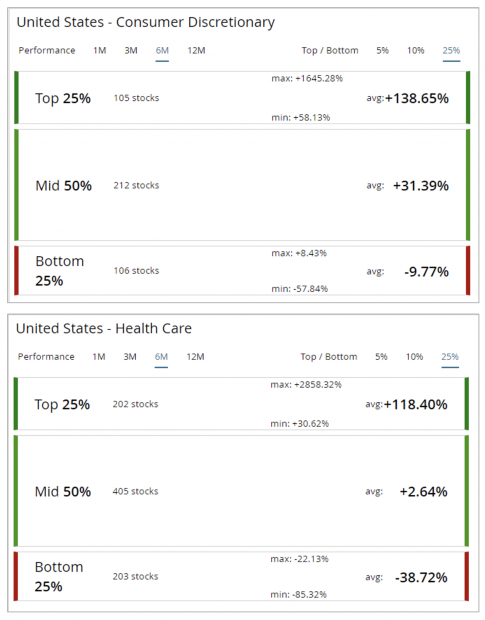
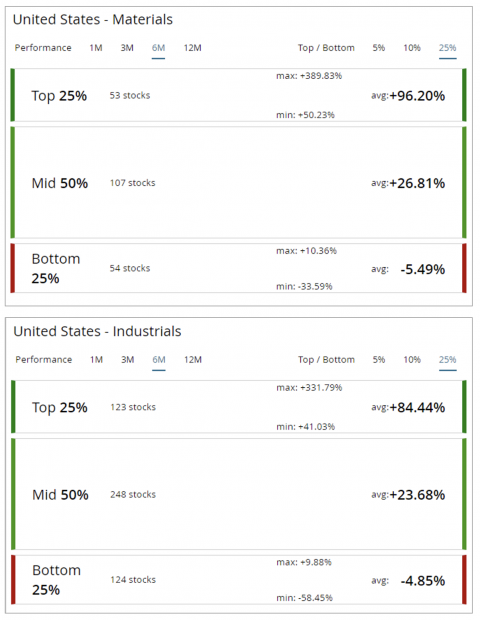
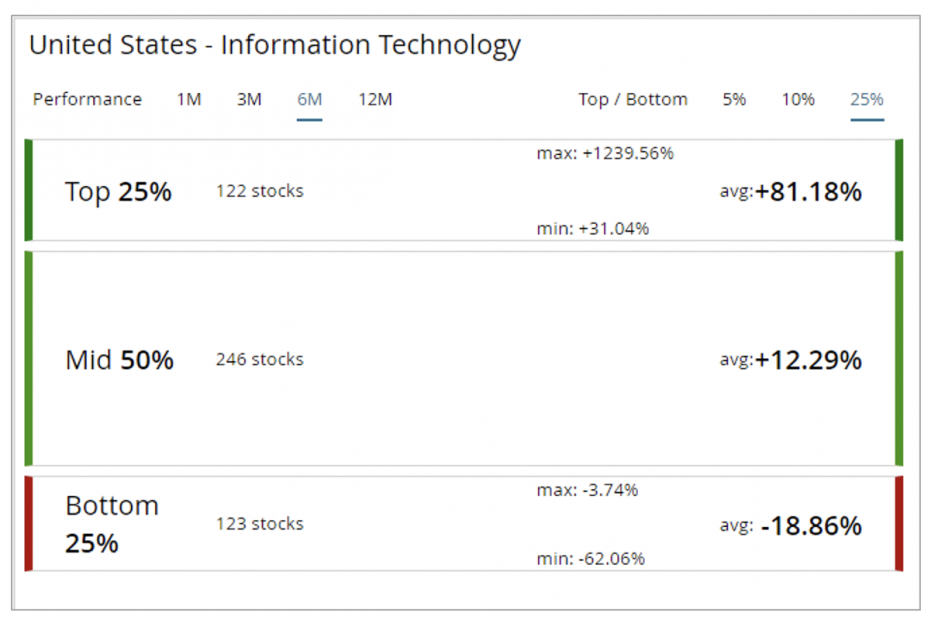
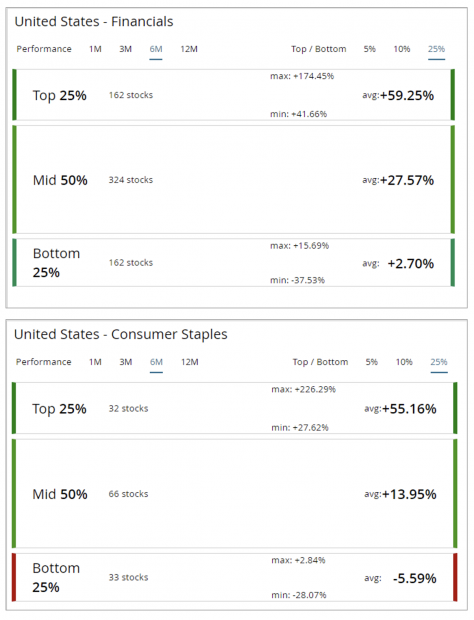
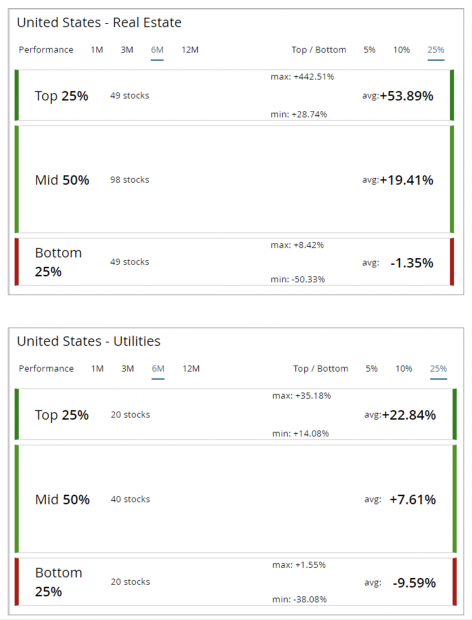
Below you will find performance dispersion for US Large Cap Stocks over the past six months.
The best average profit opportunities in the top 25% of performers by Sector were available in Consumer Discretionary, Communication Services and Energy, and least rewarding were Consumer Staples and Utilities.
Contact us at info@trendrating.net or visit www.trendrating.com and discover how you can also benefit from our unique and proprietary range of solutions
Important Information: The evaluations, rankings and information provided by Trendrating (the “Services”) are provided solely for the use of finance professionals (the “Users”) who have been issued a license to use the Services by Trendrating and who, by nature of their status as investment professions understand, or are expected to understand, the complexity of finance products, the functioning of the markets and the risks inherent in them. The Services are not offered for use by persons not employed or actively working as professionals in the finance and investment industry. The Services are to be used entirely at the risk of the Users. Included in the Services are forward-looking statements that are based on observations, assumptions and calculations that reflect Trendrating’s expectations. Forward-looking statements are subject to numerous risks and uncertainties that could cause actual results to materially differ from those expectations. The Services are not intended to constitute a recommendation of any specific security or financial product and are to be implemented solely in conjunction with or as part of a complete investment evaluation conducted by the Users. Under no circumstances shall Trendrating, its officers, directors, employees or agents be liable for any damages, lost profits or investment losses that result in any way from use of the Services or any interruptions, errors or delays in the Services. Trendrating S.A. © 2013-2020. All rights reserved.
The views and opinions expressed herein are the views and opinions of the author and do not necessarily reflect those of Nasdaq, Inc.
Source: Nasdaq Inc.