Slowing global demand, particularly in China has been cited as a major reason why metals and mining stocks performed poorly in 2015. Indeed, as recently as December, the red metal (copper) was still hitting multi-year lows. 2016 appears to be bringing a change in fortune as investors begin dipping their toes back in this sector.
At the time of writing, the SPDR S&P Metals & Ming ETF (XME) is up about 8.1%, outperforming the S&P 500 index by a healthy 13% on a year-to-date basis. The Market Vectors Gold Miners ETF is up over 35% during the same time period.
Smart Momentum analytics, as supplied by Trendrating, detects changes in momentum quickly and reliably, helping investors limit downside capture and protect profits in down markets while presenting positive momentum opportunities not to be missed by the discerning investor.
This report will utilize innovative momentum analytics to assess the health of Global Mining Stocks. It will show that Trendrating Smart Momentum analytics began upgrading stocks in this beaten down sector as early as October 2015.
Rating Distribution:
Below is the current distribution of momentum in this sector as well as the average performance of each rating:
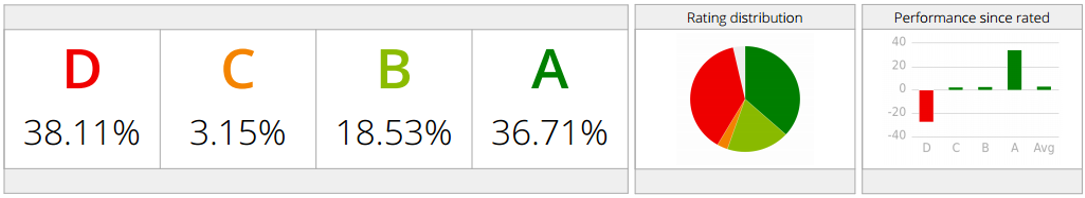
As we can see from the diagram, about 41% of Mining stocks are currently exhibiting negative momentum while 55% of stocks are in an established upward trend (A and B rated) and these have an average return (since rated) of about 35%. The historical chart of upgrades vs downgrades (see below) for this sector shows an interesting reversal.
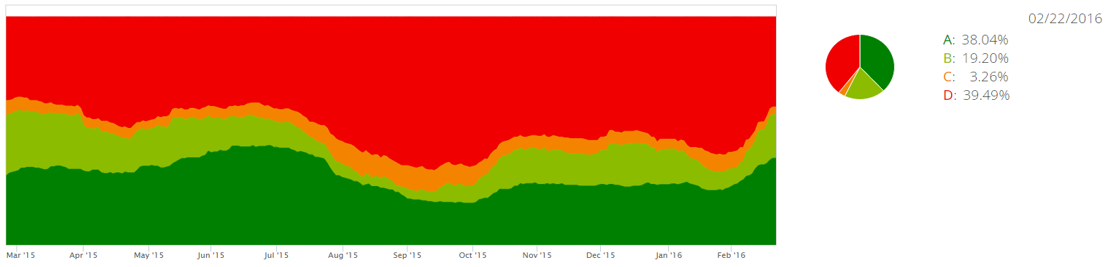
The diagram above looks at the evolution of momentum in Global Mining Stocks, over the last year. We can clearly see that since October 2015, stocks in this sector have been moving into positive momentum. So far in 2016, we have seen an acceleration of this trend.
Recent Rating Changes:
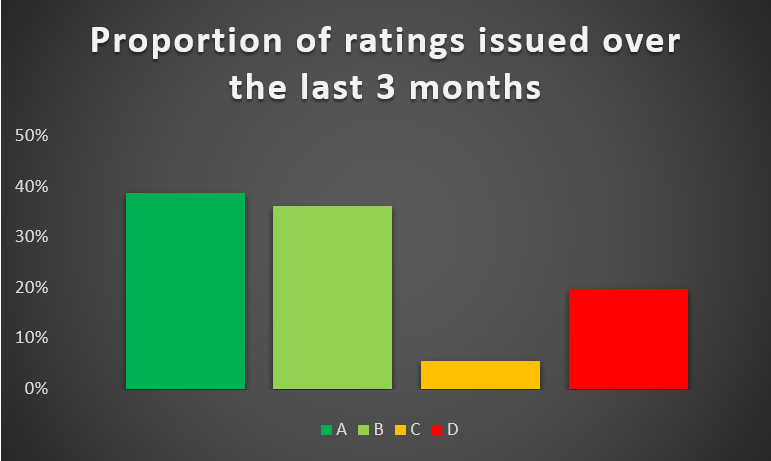
The chart above displays the Momentum Ratings changes issued by Trendrating over the last three months. We find that 75% of issued ratings have been for stocks moving into positive momentum (A and B ratings). A ratings, signifying stocks in established bull trends, were the most issued ratings over the last three months.
How are Trendrating’s momentum ratings performing in this universe?
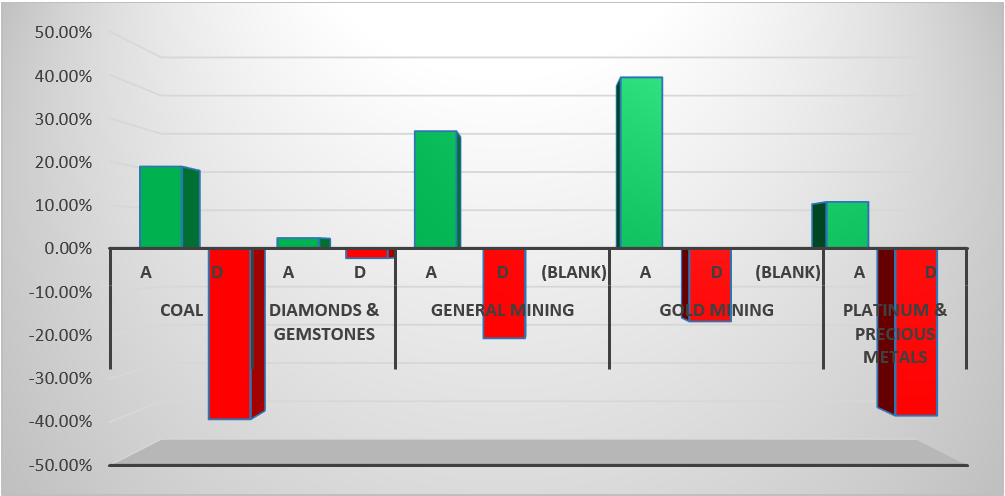
The chart above compares the performance of stocks in established positive momentum (A rated) to stocks in established negative momentum (D rated). We find that on average, A rated stocks are outperforming D rated stocks by about 45%! This outperformance is greatest in Gold mining stocks and Coal mining stocks, the sectors with the best performing A and worst performing D rated stocks respectively. Over the last three months, Coal mining stocks are down about 9% while Gold mining stocks are up about 46%.
The table below highlights some stocks in positive and negative momentum, with significant performance over the last three months.
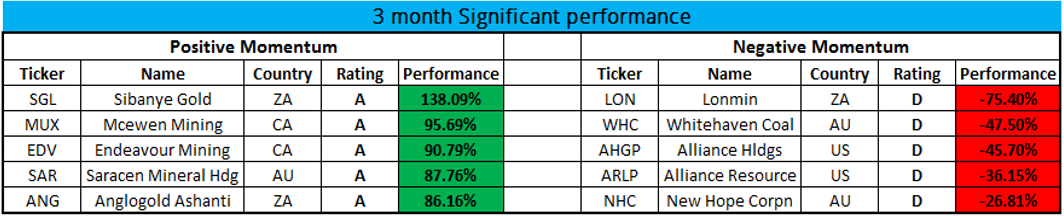
Perhaps, unsurprisingly, the top performers are all gold mining stocks and 3 of the 5 stocks in negative momentum are in Coal mining.
In conclusion, after relatively poor performance in 2015, Metal and Mining stocks have started the year with a bang. Gold mining stocks in particular have performed really well. Trendrating’s Smart Momentum model not only did a good job of identifying the turn to positive momentum in this sector early, it also correctly identified individual winning and losing stocks.
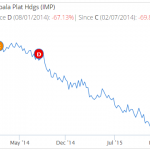
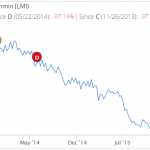
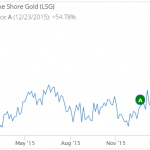
Charts:
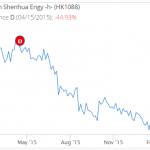
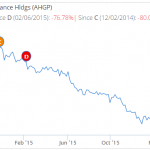
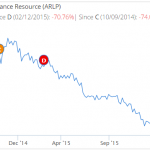
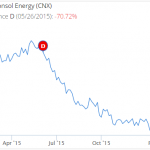
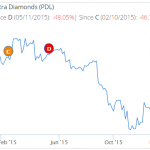
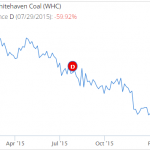
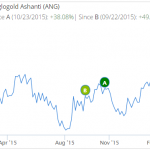
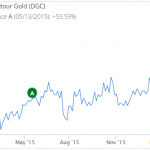
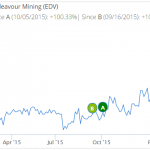
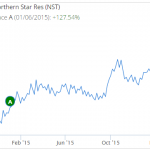
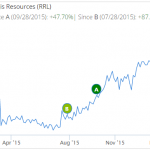
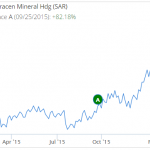
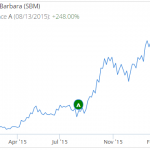
Below are some charts of positively and negatively rated mining stocks showing the timing of the most recent ratings
Positive Momentum:
Negative Momentum: