MARKET OVERVIEW
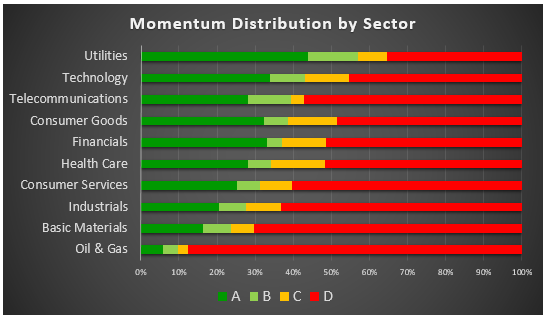
The table above shows the current distribution of momentum for the various sectors of the US Equity market. Utilities, Technology and Telecommunication sectors currently present the best opportunities for spotting equities with positive momentum. Basic Materials and Oil & Gas stocks, on the other hand, have the vast majority of their constituents trending negatively.
MOMENTUM EVOLUTION
The graph below displays the evolution of momentum, in US Equity, over the last 20 business days.
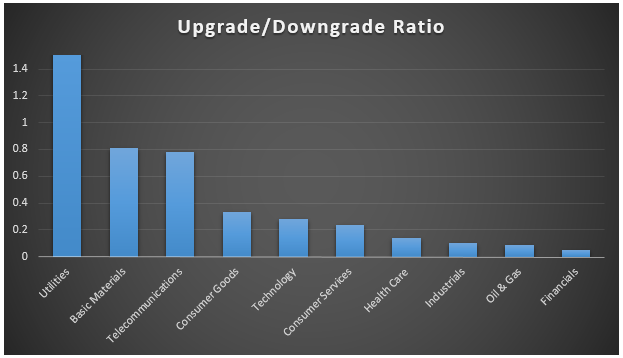
It shows that Utilities was the only sector with more upgrades than downgrades. Industrials, Oil & Gas and Financials had the highest proportion of stocks moving into negative momentum during this period.
3-MONTH SIGNIFICANT PERFORMANCE
The table below shows some of the best and worst performing US stocks over the last three months.

RECENT MOMENTUM CHANGES
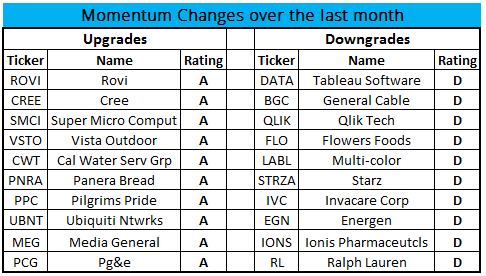
The table below shows some US stocks that have seen a recent change in momentum
STOCKS HITTING LONGER TERM HIGHs
STOCKS HITTING LONGER TERM LOWs

