Since about August 2014, Oil prices have been heading lower. From a high of about $114, Brent Crude dropped as low as $27.9 before recovering. Below is a one-year chart for Brent Crude from Trendrating.
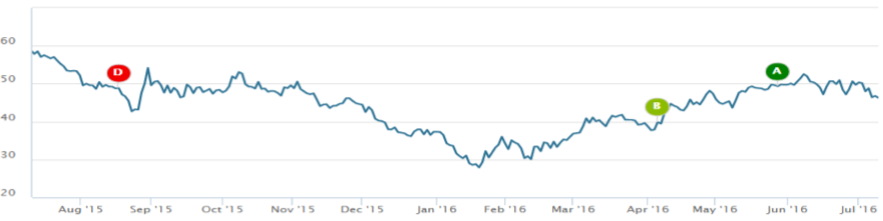
The graph clearly shows the steep fall in crude and the recovery, post March. Trendrating currently has a positive rating on Brent Crude.
Smart Momentum analytics, as supplied by Trendrating, detects changes in momentum quickly and reliably, helping investors limit downside capture and protect profits in down markets while presenting positive momentum opportunities not to be missed by the discerning investor. This report will utilize innovative momentum analytics to assess the health of Global Oil & Gas Stocks. It will show that Trendrating Smart Momentum analytics began upgrading stocks in this beaten down sector as early as March and has done a great job of separating winners from losers.
Rating Distribution:
Below is the current distribution of momentum in the Oil & Gas sector as well as the three-month performance of the most extreme performers in each rating category:
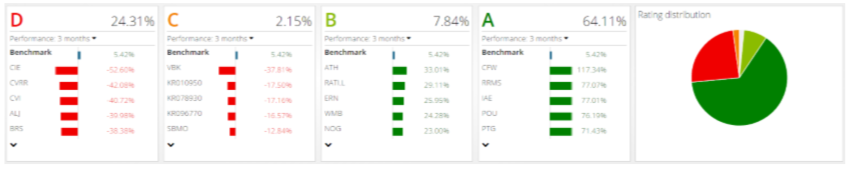
As we can see from the diagram, about 64% of Oil & Gas stocks are currently A rated. Positive momentum stocks are mainly out-performing the benchmark, MSCI World Energy index, while negatively rated stocks are mainly a drag on performance.
Evolution of Ratings:
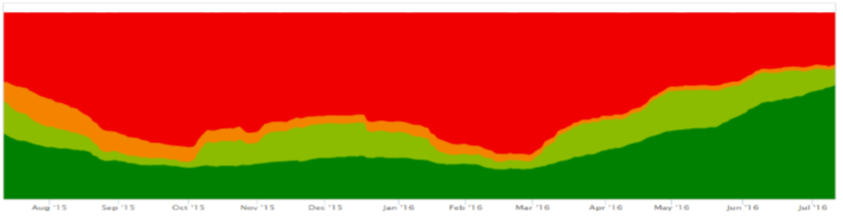
The diagram above looks at the evolution of momentum in Global Oil & Gas Stocks, over the last year. We can clearly see that since about March, stocks in this sector have been moving into positive momentum tracking the recovery of BRENT from its lows.
Recent Rating Changes
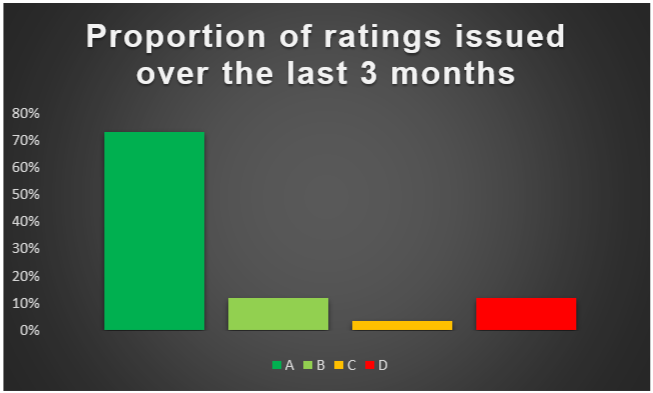
The chart above above displays the Momentum Ratings changes issued by Trendrating over the last three months. We find that 85% of issued ratings have been for stocks moving into positive momentum (A and B ratings). A ratings, signifying stocks in established bull trends, were the most issued ratings over the last three months.
How are Trendrating’s momentum ratings performing in this universe?
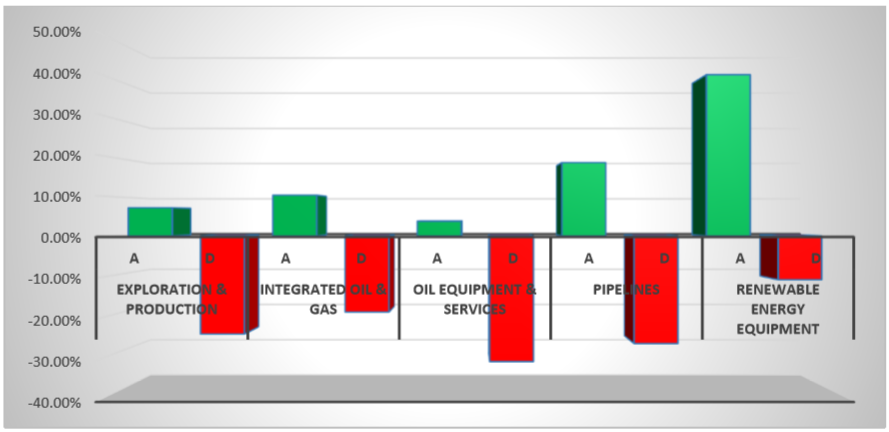
The chart above compares the performance of stocks in established positive momentum (A rated) to stocks in established negative momentum (D rated) in Oil & Gas sub-sectors. We find that on average, A rated stocks are out-performing D rated stocks by about 40%. This out-performance is greatest in Renewable Energy Equipment, the sub-sector with the best performing A rated stocks. The model has done a great job of separating winners from losers in each sub-sector.
The table below highlights some of the best performing stocks, in positive and negative momentum, over the last three months.
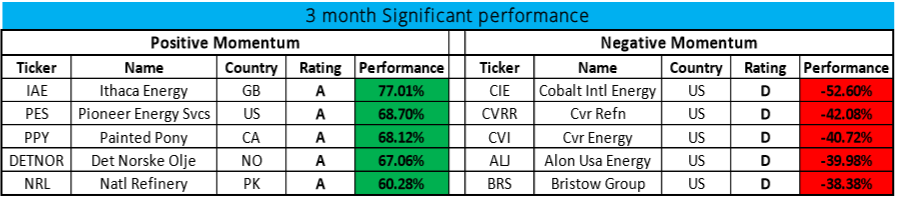
While most stocks on this table are in the Exploration & Production sub-sector, here again we can see a clear separation of winners from losers.
Oil & Gas stocks have recovered, along with Oil prices, since late February. Trendrating is currently bullish on Oil & Gas and has been upgrading securities in this sector over the last few months. Trendrating has done a good job of distinguishing winners from losers.
Charts:
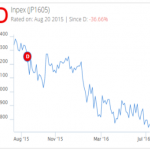
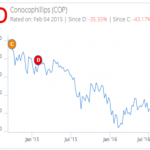
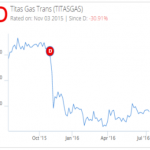
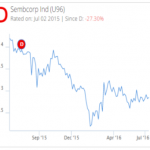
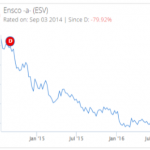
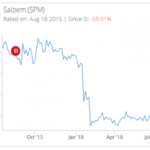
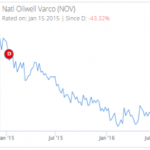
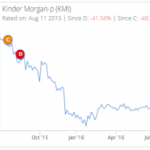
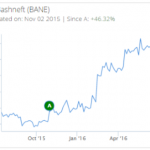
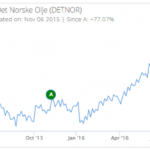
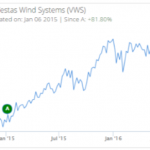
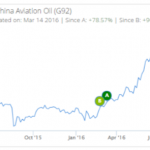
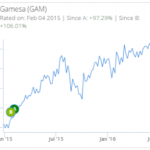
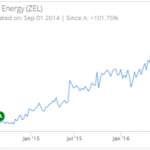
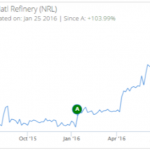
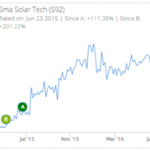
Below are some charts of positively and negatively rated mining stocks showing the timing of the most recent ratings
Positive Momentum:
Negative Momentum: