The most hated bull market in history charges ahead. The Fed’s interest rate decision, delivered in Janet Yellen’s speech, cheered markets putting risk assets back in play….at least for now. The Nasdaq 100 briefly traded at an all-time high yesterday (Sept 22, 2016) and closed just below that level. In markets like these that are clearly disconnected from fundamentals, investors need additional tool-sets to better control risks and pick winning securities.
Smart Momentum analytics, as supplied by Trendrating, detects changes in momentum quickly and reliably, helping investors limit downside capture and protect profits in down markets while presenting positive momentum opportunities not to be missed by the discerning investor.
This report will utilise innovative momentum analytics to explore the constituents of the Nasdaq 100 index. We will look at the current Rating distribution, performance and evolution. We will also look at specific examples of securities in long term bull trends and others that are just beginning a bull run.
Rating Distribution:
Below is the current distribution of momentum ratings in the Nasdaq 100 index.
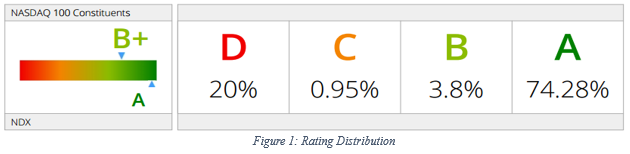
As we can see from the diagram, about 78% of this universe is currently trending positively. The Nasdaq 100 has strong performance because a large proportion of its securities currently have strong positive momentum ( A rating).
Rating Performance:
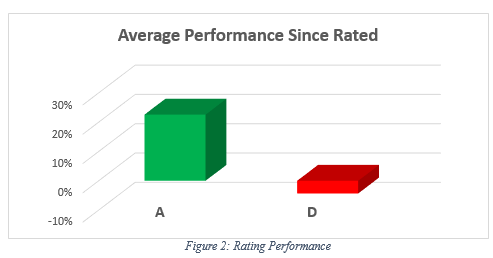
Figure 2 above displays the average performance of A and D rated constituents of the Nasdaq 100 index, since their latest rating. As we can see, A rated securities have returned over 20% while D rated securities have been a drag on index performance.
Evolution of Ratings:
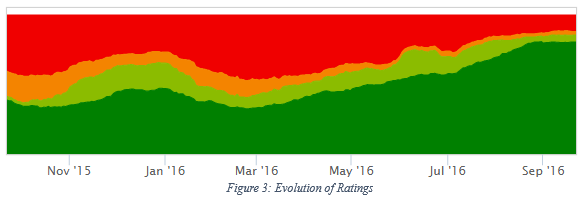
The diagram above looks at the evolution of momentum in the US Technology sector, over the last year. We can clearly see that there has been a steady move to positive momentum since early February.
Trendrating Smart Momentum analytics give value investors an accurate, systematic way to measure price momentum and participate in strong trends even when fundamentals don’t make sense.
CHARTS
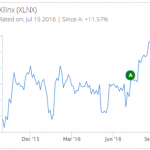
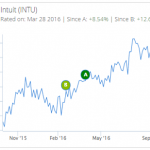
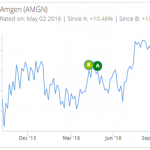
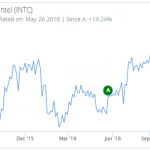
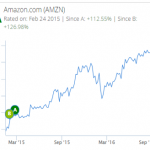
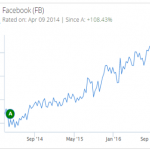
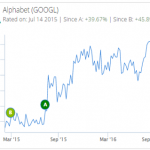
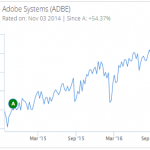
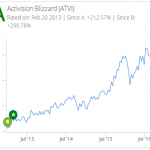
Older/ Established Positive Trends:
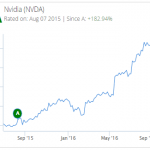
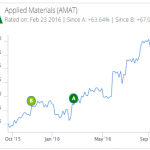
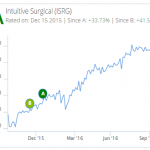
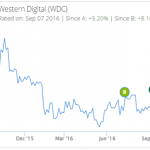
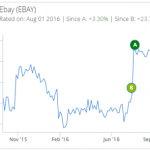
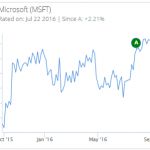
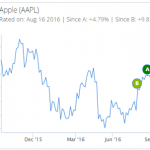
New/ Emerging Opportunities: