
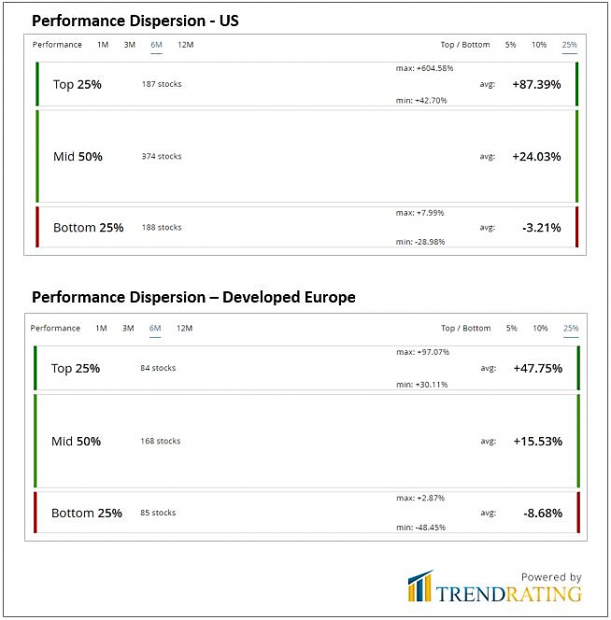
The current economic scenario is producing a quite extreme “performance dispersion“ across stocks. Here below is the distribution of the average performance for large cap stocks listed in US and Europe over the last 6 months.
The delta of performance between the top 25% performers and the bottom 25% is as wide as 90% in US and 55% in Europe. This dispersion provides a great opportunity for active equity managers. It is all about capturing trends, using cutting edge analytics and technology that can enrich investment strategies and facilitate discriminating between winners and losers in a timely fashion. This is the new frontier of active management. – Rocco Pellegrinelli, CEO of Trendrating
October Sector Allocations
Methodology
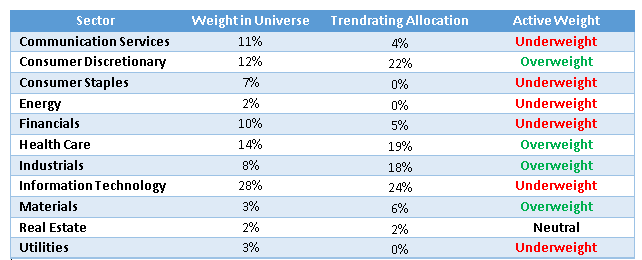
To arrive at our monthly Sector Allocations, we delineate the S&P 500 universe of stocks into five groups based on their Smart Momentum Score (SMS). Any stock that has retraced at least 20% from a trend high is considered an outlier. The sector allocation is then found by looking at the proportion of names within quantile one for each sector. To control risk, no sector can represent more than double its weighting in the index.
Suggested Allocations
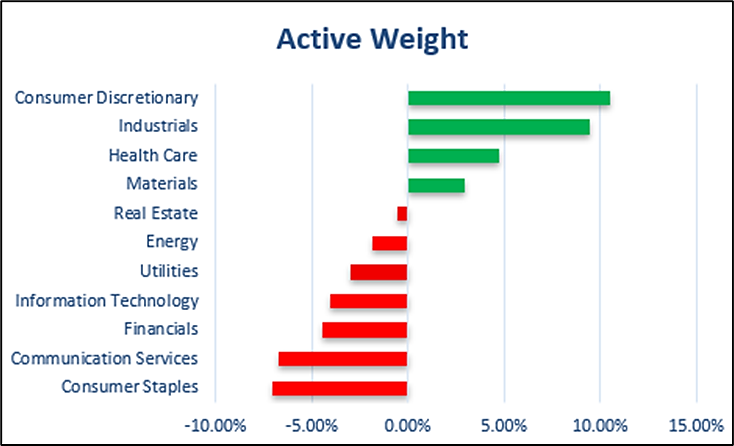
Over the last few months, the market has been driven by a handful of securities. The Trendrating model is heavily overweight Consumer Discretionary and Industrials and has slight overweights to Health Care and Materials. Conversely, Trendrating identifies the sectors with the weakest trends as Consumer Staples, Communication Services, Financials, Information Technology, and Utilities. We are neutral on Real Estate and Energy, which have a deviation of less than +/- 2% from the index weighting.
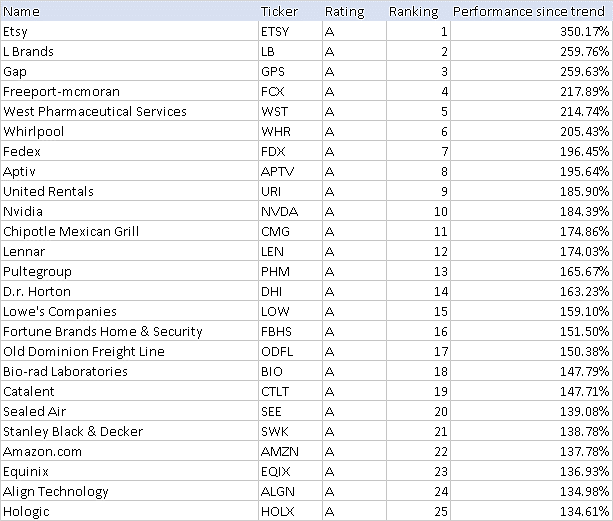
Top Trending Stocks in the S&P 500
Methodology
Each month we distribute the Trendrating 100 list to our clients. We delineate the S&P 500 universe of stocks into five groups based on their Smart Momentum Score (SMS) and retracement value. Any stock that has retraced over 10% from a trend high is considered an outlier. This leaves us with a list of names in which our Model has high conviction. The market environment will dictate the number of names in the Top 100 list, but it will typically range from 80-100 companies. Here will be highlighting the Top 25 companies each month. Contact Trendrating for the complete list.
Trendrating Terminology
Rating Grade: A = Strong Bull Trend / B = Emerging Bull Trend / C = Emerging Bear Trend / D = Strong Bear Trend
Smart Momentum Score (SMS): is a continuous rating scale between -3 and 3, measuring the strength of the trend since that trend began. The metric allows the model to differentiate between securities of the same ratings, whether that is an A, B, C or D rated security.
Retracement: The percentage off the peak of the trend for positive trends or off the bottom for negative trends.
Additional Information
Proven Effectiveness – A 20-year back test supporting Trendrating’s sector allocation approach.
Trendrating Brochure – An overview of the services we offer.
Pinnacle Trendrating Innovative Equity Fund (IPTRX) – A mutual fund utilizing our trend capture model.
Contact us to request more information about Trendrating’s web-based platform
ANY AND ALL INFORMATION PROVIDED BY TRENDRATING OR DERIVED FROM TRENDRATING’S DATA IS PROVIDED “AS IS” AND TRENDRATING MAKES NO WARRANTY OF ANY KIND, EXPRESS OR IMPLIED, INCLUDING, WITHOUT LIMITATION, ANY WARRANTIES OF MERCHANTABILITY OR FITNESS FOR A PARTICULAR PURPOSE. Trendrating has no affiliation with any company mentioned in this report.
The views and opinions expressed herein are the views and opinions of the author and do not necessarily reflect those of Nasdaq, Inc.
Source: Nasdaq, Inc.