
Russell 3000 Performance Dispersion Gap Has Closed Significantly Over Past Six Months
The price performance gap of stocks that constitute the top and middle tiers of the Russell 3000 continued to shrink in August.
The top 25% of constituents in the Index had a combined average performance return of 206.52% six months ago, while the middle 50% returned on average over 57%. At the start of September, this ratio has shrunk to plus 19% average return for the top tier and a mere 1.55% average gain for the middle tier. The bottom 25% of stocks in the Russell 3000 are currently down over 11%, which means for active stock pickers, there is still a wide choice of positive trends to ride and negative trends to avoid.
Performance dispersion exists and offers outperformance opportunities to be captured by smart investors. Trendrating provides a unique rating model and additional advanced analytics designed to capture trends, identifying most of the strongest and weakest constituents in any equities universe within a yearly horizon.
Any investment strategy can be enhanced by a better synchronization to trend development. Most investors use numerous metrics based on fundamental and quantitative data, but very few measure in a proven, objective and systematic way, the real direction of price trends and remain hostage to market noise and opinions, despite the fact that capturing trends is the key to better returns.- Rocco Pellegrinelli, CEO of Trendrating
September Sector Allocations
Methodology
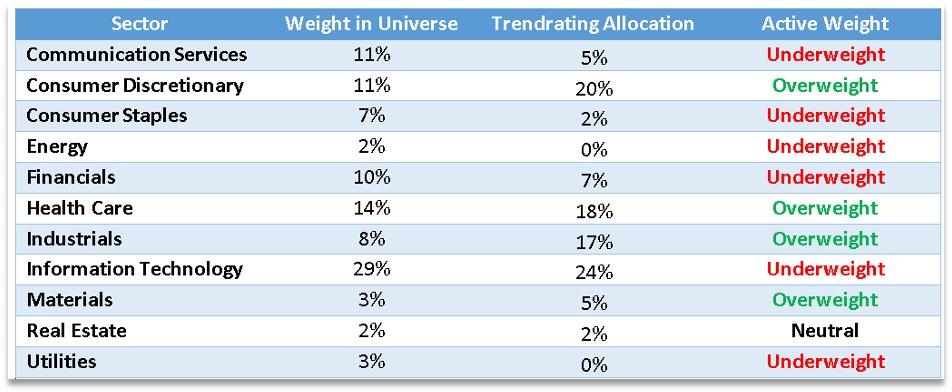
To arrive at our monthly Sector Allocations, we delineate the S&P 500 universe of stocks into five groups based on their Smart Momentum Score (SMS). Any stock that has retraced at least 20% from a trend high is considered an outlier. The sector allocation is then found by looking at the proportion of names within quantile one for each sector. To control risk, no sector can represent more than double its weighting in the index.
Suggested Allocations
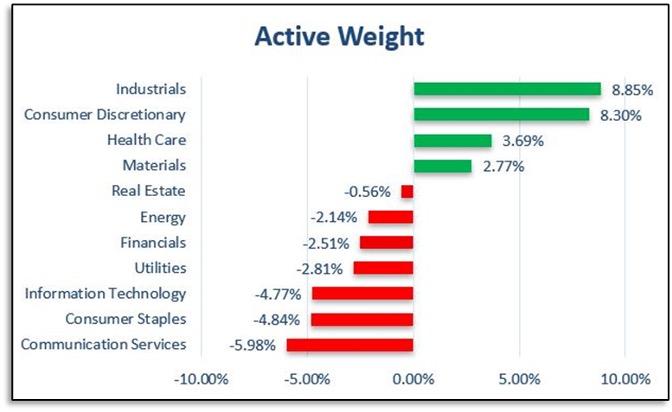
Over the last few months, the S&P 500 has continued its ascent, mainly boosted by a small group of high fliers that have propped up the Index. The Trendrating model remains heavily overweight in Health Care and has a slight overweighting on Industrials and Materials. Conversely, Trendrating identifies the sectors with the weakest trends as Communication Services, Utilities, Consumer Staples, and Energy. We are neutral on the other four sectors, which all have a deviation of less than +/- 2% from the index weighting.
Top Trending Stocks in the S&P 500
Methodology
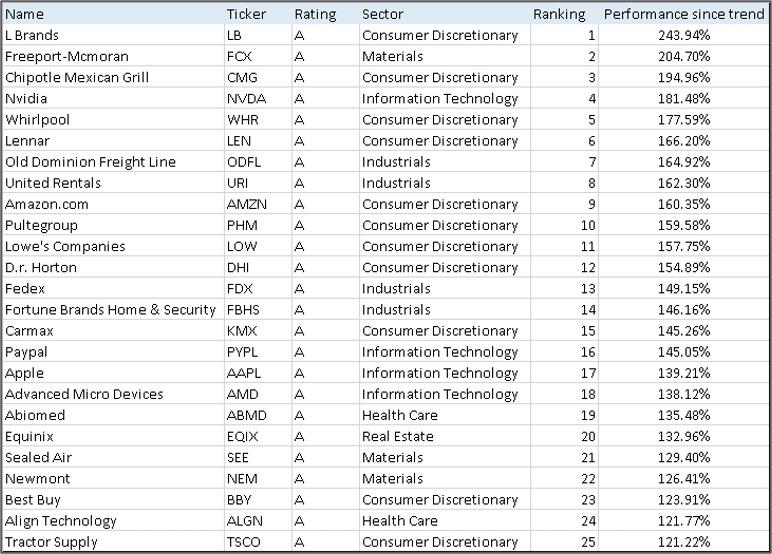
Each month we distribute the Trendrating 100 list to our clients. We delineate the S&P 500 universe of stocks into five groups based on their Smart Momentum Score (SMS) and retracement value. Any stock that has retraced over 10% from a trend high is considered an outlier. This leaves us with a list of names in which our Model has high conviction. The market environment will dictate the number of names in the Top 100 list, but it will typically range from 80-100 companies. Here will be highlighting the Top 25 companies each month. Contact Trendrating for the complete list.
Trendrating Terminology
Rating Grade: A = Strong Bull Trend / B = Emerging Bull Trend / C = Emerging Bear Trend / D = Strong Bear Trend
Smart Momentum Score (SMS): is a continuous rating scale between -3 and 3, measuring the strength of the trend since that trend began. The metric allows the model to differentiate between securities of the same ratings, whether that is an A, B, C or D rated security.
Retracement: The percentage off the peak of the trend for positive trends or off the bottom for negative trends.
Additional Information
Proven Effectiveness – A 20-year back test supporting Trendrating’s sector allocation approach
Trendrating Brochure – An overview of the services we offer
Pinnacle Trendrating Innovative Equity Fund (IPTRX) – A mutual fund utilizing our trend capture model
Contact us to request more information about Trendrating’s web-based platform
ANY AND ALL INFORMATION PROVIDED BY TRENDRATING OR DERIVED FROM TRENDRATING’S DATA IS PROVIDED “AS IS” AND TRENDRATING MAKES NO WARRANTY OF ANY KIND, EXPRESS OR IMPLIED, INCLUDING, WITHOUT LIMITATION, ANY WARRANTIES OF MERCHANTABILITY OR FITNESS FOR A PARTICULAR PURPOSE. Trendrating has no affiliation with any company mentioned in this report.
The views and opinions expressed herein are the views and opinions of the author and do not necessarily reflect those of Nasdaq, Inc.
Source: Nasdaq, Inc.