

Trendrating U.S. Performance Dispersion Navigator – January 2024
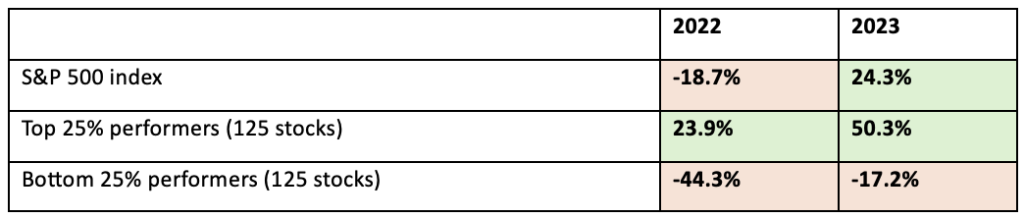
Performance dispersion is the opportunity. Here is the performance of the S&P 500 index over the last three years: up 27% in 2021, down -19% in 2022 and up 24% in 2023. This “roller coaster” behavior of the market is here to stay, according to experts. The new stock market cycle is exposing how volatile and erratic performance returns from indices and passive strategies can be.
The only way to deliver superior performance on a consistent basis across the ups and downs of the stock market is intelligent active management that can profit from the performance dispersion across stocks.
Dispersion facts: In 2022, the top 25% performers in the S&P 500 index recorded an average gain of 23.9% vs. a double-digit loss for the benchmark. In 2023, the top performers posted an average profit of twice the index. (Data as of January 2, 2024. Source: Trendrating).
Analyzing the performance dispersion across markets and sectors enables investors to make more informed investment decisions. To that end, Trendrating will be sharing our research on an ongoing basis through our new Trendrating U.S. Performance Dispersion Navigator monthly reports, with this January 2024 report being our first edition.
Here is the comparison of dispersion across U.S. sectors for the last 12 and 3 months (large and mid-cap stocks investment universe):
Performance dispersion data of large & mid-cap U.S. stocks for the last 12 months. (Data as of January 15, 2024. Source: Trendrating).
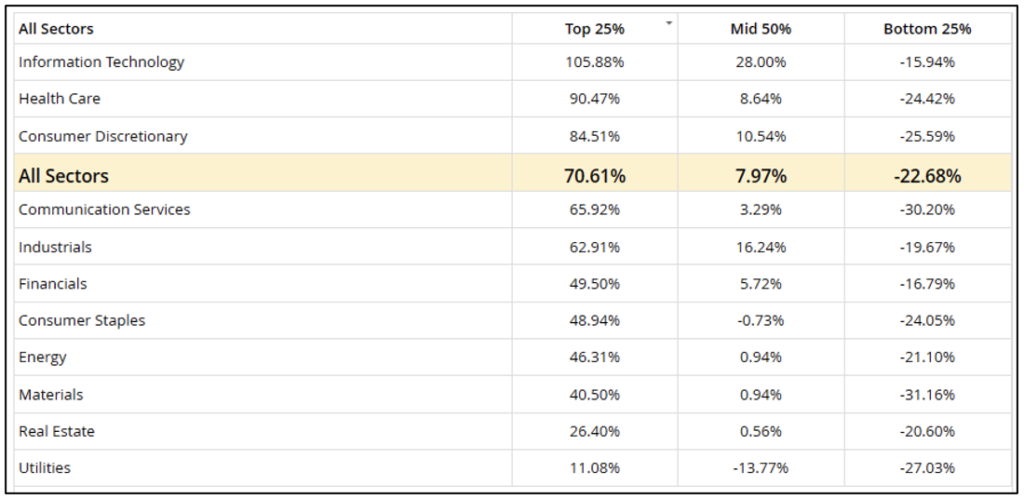
Over the 12-month window, the chart above reveals that the sectors offering the biggest upside potential – as measured by the average return of the top 25% performers – were Information Technology, Health Care and Consumer Discretionary.
At the bottom of the list, we find Utilities and Real Estate that show a poor ratio in terms of average performance between the top and the bottom quartile.
Performance dispersion data of large & mid-cap U.S. stocks for the last three months. (Data as of January 15, 2024. Source: Trendrating).
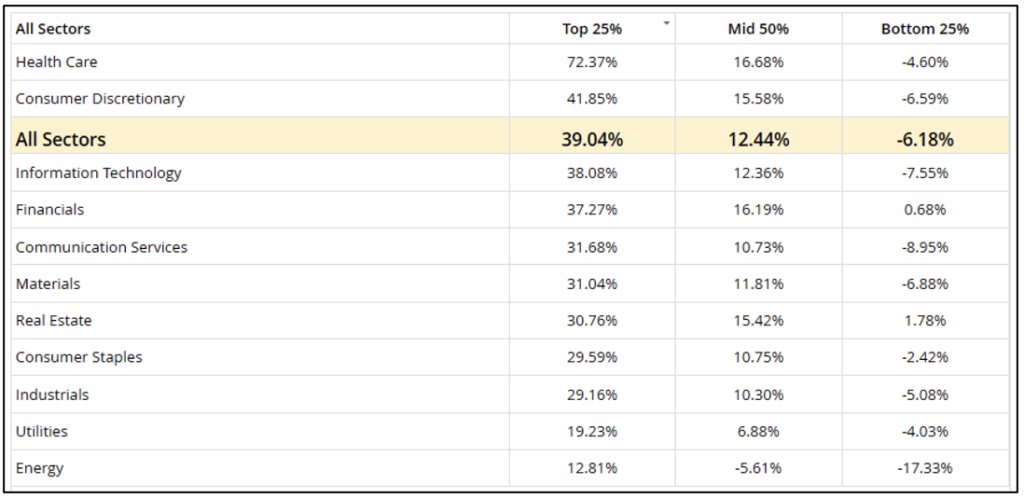
In the last three months, we observe some improvement in the relation of average returns between the top and the bottom quartiles for Utilities and Real Estate and emerging weakness in Energy.
Tracking the evolution of the ratio between best and worst performers can provide insights about trend reversals and sector rotation. Closely monitoring the performance dispersion can help navigating the ups and downs of any market regime.
Additional Information:
Improve Your Control Over The Risks of The New Market Cycle – A brief video about our services.
Alpha dispersion – Performance dispersion insights.
Any and all information provided by Trendrating or derived from Trendrating’s data is provided “as is” and Trendrating makes no warranty of any kind, expressed or implied, including without limitation, any warranties of merchantability or fitness for a particular purpose.
The views and opinions expressed herein are the views and opinions of the author and do not necessarily reflect those of Nasdaq, Inc.