
US Technology stocks like most other sectors, have endured a terrible start to 2016. At the time of writing, The Nasdaq Composite index is down 14.6% on a YTD basis and underperforming the S&P 500 index by about 5%. Dismal forecasts from companies such as LinkedIn Corp (LNKD) and Tableau Software (DATA), the strong dollar and disappointing recent earnings and economic reports are all reasons why investors have decided to reduce their allocation to this sector and take profits, especially given the relatively strong performance of Technology stocks in 2015.
Smart Momentum analytics spots negative trends early, helping to limit downside capture and protect profits. This report will utilize Trendrating’s Smart Momentum analytics to explore momentum in US Technology Stocks.
Below is the current distribution of momentum in this sector:
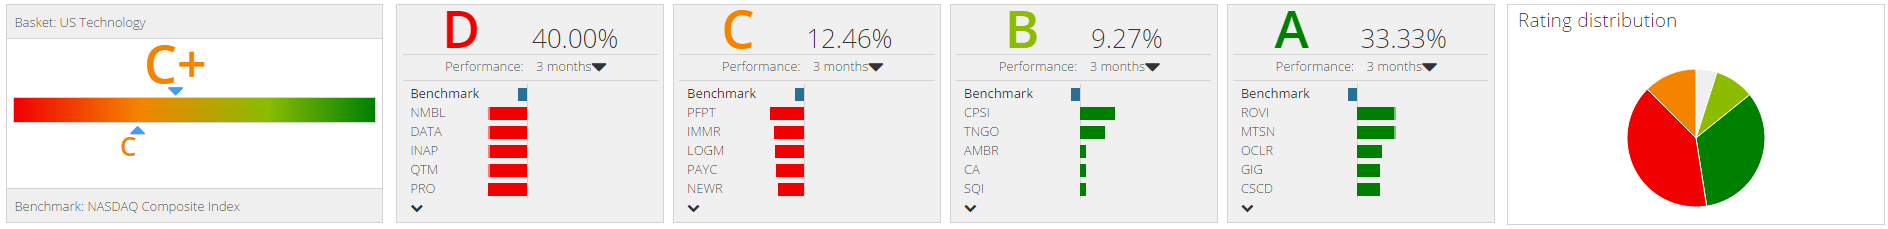
As we can see from the diagram, nearly 53% of Technology stocks are currently exhibiting negative momentum, creating a drag on our portfolio, however, about 33% of stocks are in an established upward trend (A rated) and these have an average return (since rated) of about 10%.
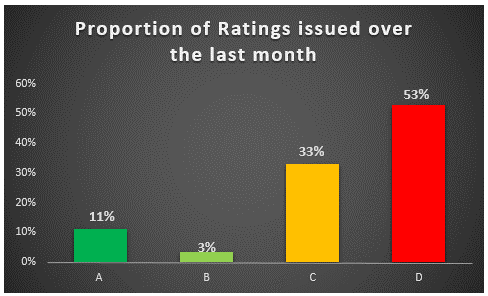
The chart above displays the Momentum Rating changes issued by Trendrating over the last month. We find that the vast majority, over 50% of issued ratings, has been for stocks entering established bear trends (D rating).
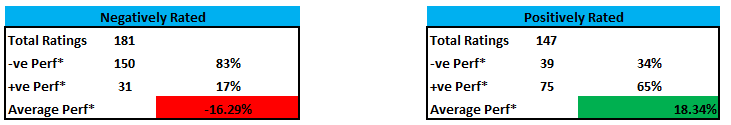
The tables above summarise the performance of Negative momentum securities and of Positively rated securities (A rated).
We see that 83% of the negatively rated securities have delivered negative performance. On average, negatively rated stocks are down about 16.3% since their most recent rating. On the other hand, 65% of A rated securities currently have positive performance with an average rating performance of about 18.3%
The table below displays some of the best and worst performing US Technology stocks over the last three months.
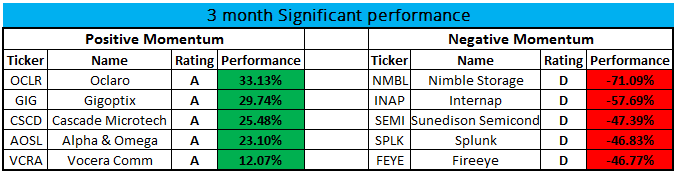
When we look at the 3-month performance of securities that have been rated for at least that period of time, we find that some positive momentum stocks have delivered and are still delivering spectacular returns even in challenging market conditions.
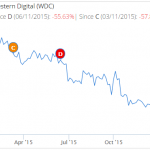
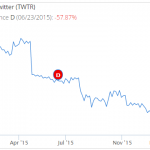
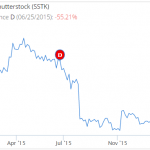
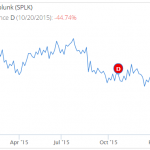
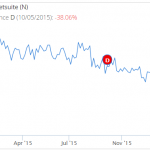
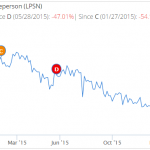
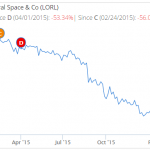
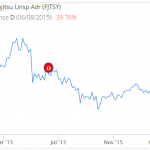
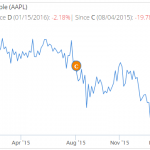
Below are example charts for some securities in negative momentum showing the timing of the rating:
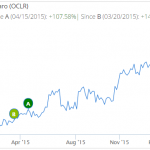
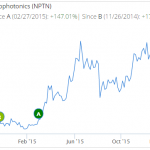
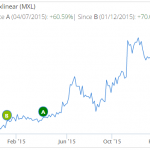
Here are a few examples of positive momentum securities that continue to deliver outstanding results:
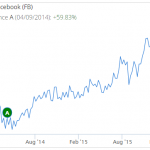
In conclusion, US Technology stocks have underperformed the broader US market and have continued in a downward trend. Trendrating’s Smart Momentum Model was able to capture the turn in most US Technology stocks early enough to protect profits and limit downside capture. In addition, positive momentum securities like Facebook and Alphabet continue to show great, benchmark beating performance.